
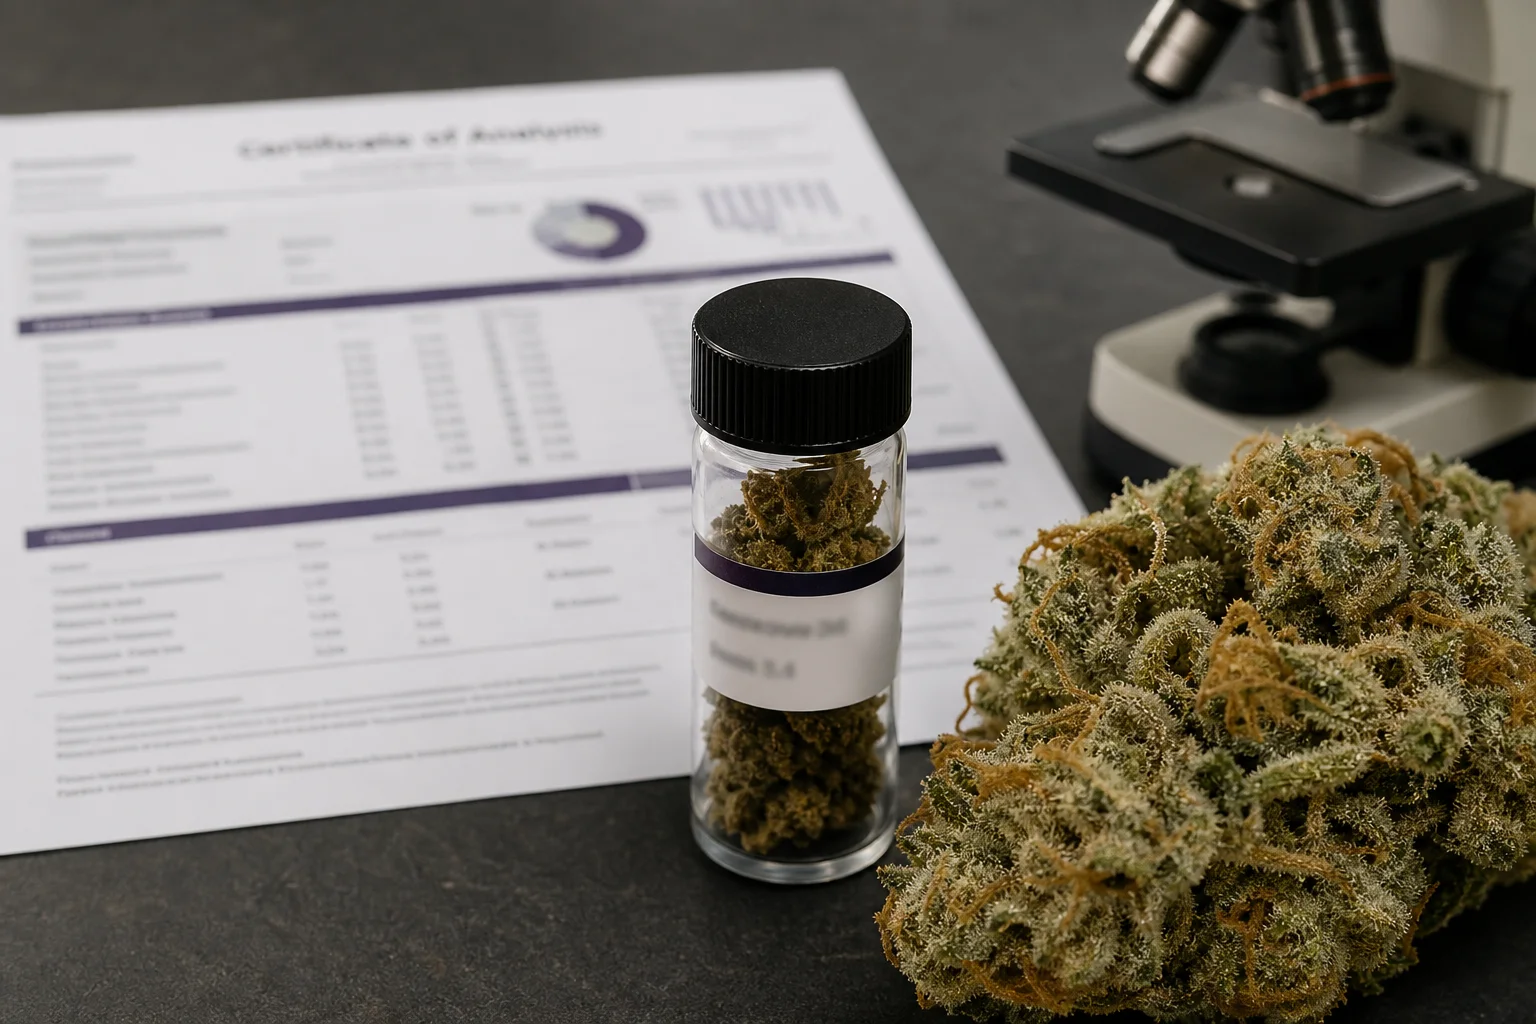
A staged documentary image linking a Certificate of Analysis (text intentionally unreadable) with the physical sample it represents. This brief teaches that COAs are tied to specific samples and that visual context (bud appearance, trichomes) complements, but does not replace, analytic reporting. Limit: do not show readable statistics or lab results.
What "THC percentage" actually measures
When a label says “THC: 22%,” laboratories are usually reporting percent weight-by-weight (percent w/w) of total Δ9‑tetrahydrocannabinol in the tested material. For dried flower, that number is derived from the measured amounts of Δ9‑THC and THCa in the sample and an established conversion factor for THCa→Δ9‑THC (because THCa decarboxylates into Δ9‑THC when heated). That percent figure is a straightforward analytic output — but it’s the end of a chain of sampling, extraction, and calculation steps, not a stand-alone truth about every bud in the jar. (nvlpubs.nist.gov)
Laboratories may report THC as “total Δ9‑THC” (accounting for THCa) or simply Δ9‑THC. Units vary too: percent w/w, milligrams per gram (mg/g), or milligrams per serving for processed products. All of these are interconvertible when the sample and serving size are clearly defined, but differences in labeling convention can confuse consumers who compare numbers across product types. (pubmed.ncbi.nlm.nih.gov)
Finally, remember that a percent is a ratio measured at one time on one sample under specific test conditions. It’s an objectively reported number, but it’s tied to that sample’s history — where it came from on the plant, how the plant was dried, when it was sampled — and those contextual details matter for interpretation. (nist.gov)
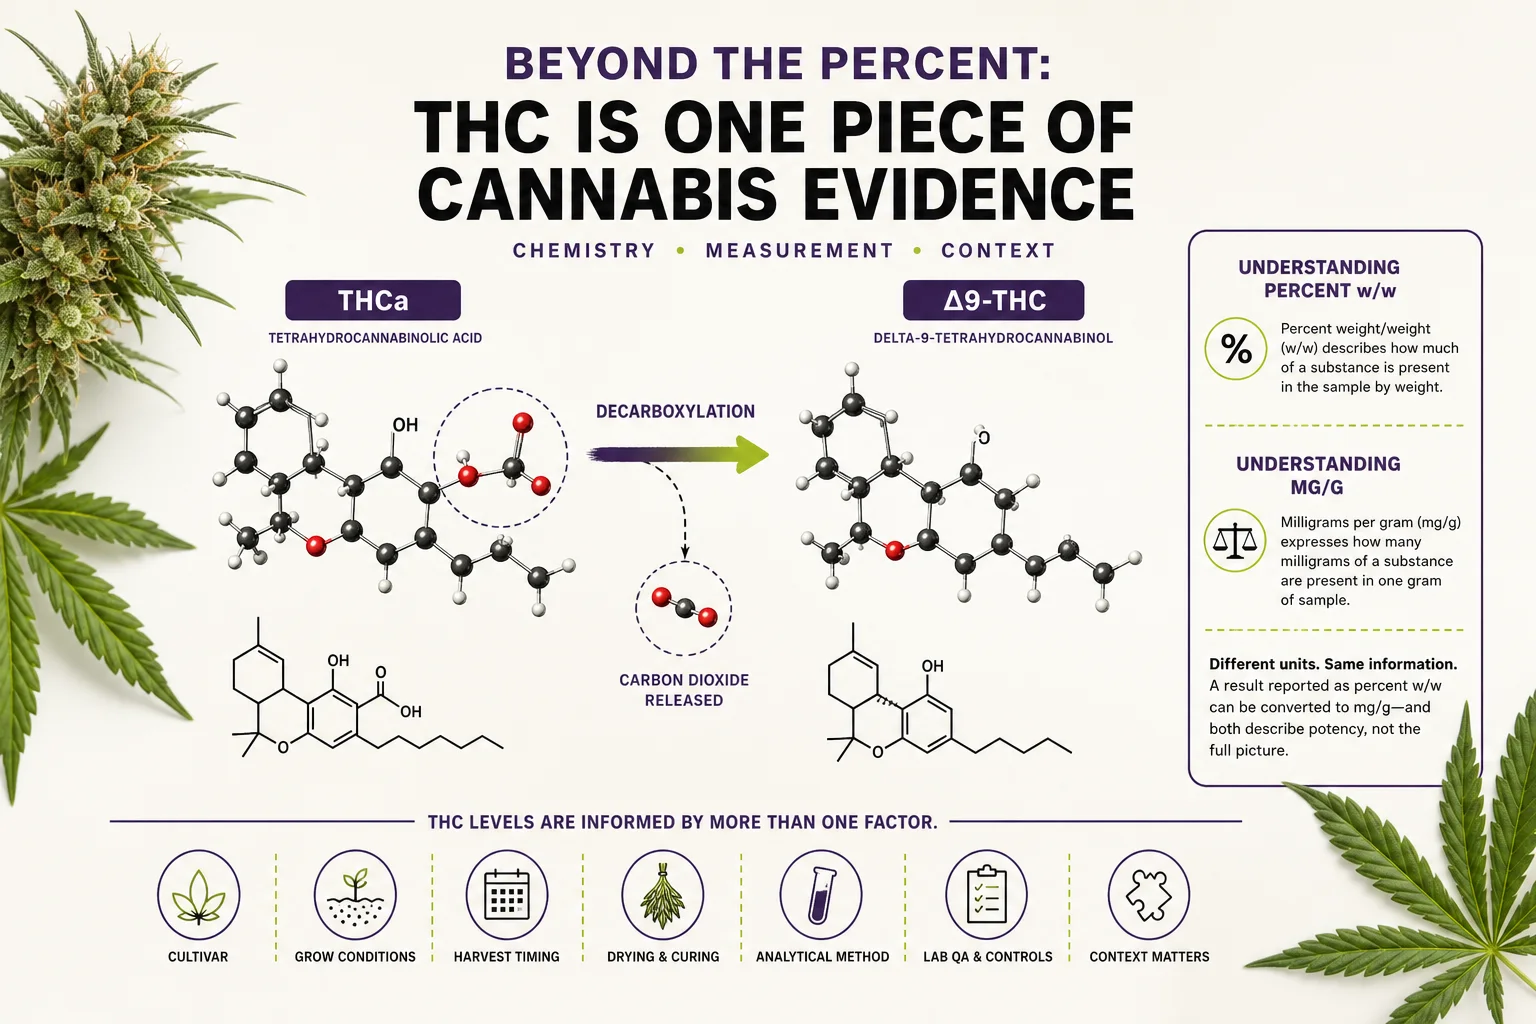
An explanatory diagram showing THCa and Δ9‑THC, the decarboxylation relationship, and how labs convert measured THCa into a total Δ9‑THC percentage. The diagram teaches conversion rationale and its place in reporting; it does not include any real COA values.
Research context: Cannabis Laboratory Quality Assurance Program: Exercise 2 Cannabinoid Final Report (NIST IR 8519)How sampling shapes the number
A certificate of analysis (COA) and the THC percentage it lists are only as representative as the sample sent to the lab. For whole-plant batches, a single sample may come from particular plants, particular buds, or a homogenized pool; Maine’s testing system requires licensed testing facilities to receive electronic data deliverables and to issue COAs to licensees, but the rules that govern how trade, retail, or research samples are collected influence whether a result reflects an entire lot or one corner of it. (www11.maine.gov)
Sampling decisions — how many subsamples, where on the plant they came from (top cola vs. lower nodes), and whether the sample was crushed, dried uniformly, or kept fresh — can shift measured potency. That’s why producers and testing labs use documented sampling plans and why participation in proficiency and quality programs is essential: sampling is not a trivial step you can skip when you want a reliable number. (nvlpubs.nist.gov)
For Maine growers and consumers, learning whether a COA came from a consumer sample, trade sample, or an internal R&D sample matters because the OCP keeps separate guidance and reporting for these sample types; the COA’s representativeness should be disclosed in licensee records and accompanying documentation. (maine.gov)
Laboratory methods, reference materials, and inter‑lab variability
Measuring cannabinoids reliably depends on validated analytical methods — typically chromatography (HPLC or GC with appropriate derivatization) — and on the lab’s competence and controls. NIST’s Cannabis Laboratory Quality Assurance Program and their reference-material work exist precisely because different instruments, extraction procedures, and calibration standards can produce different potency results from the same physical sample. When labs participate in interlaboratory exercises or use botanical reference materials, their results become more comparable and trustworthy. (nist.gov)
Reference materials and validated methods reduce systematic bias. NIST has developed natural-matrix reference materials and published interlaboratory final reports that document how a group of participant labs performed across exercises — that reporting is how regulators and growers can understand the limits of comparability between labs. But not every lab will have identical performance, and that performance can vary by analyte (for example, cannabinoids vs. minor terpenes vs. pesticide residues). (nvlpubs.nist.gov)
The upshot for Maine producers: a THC percentage printed on a retail label is the lab’s best measurement for that submitted sample under specific method conditions. It is not a universal constant for an entire cultivar or for every product batch unless sampling, testing, and documentation were designed to ensure that representativeness. Participation in quality assurance programs and transparent COA reporting help close that gap. (nist.gov)
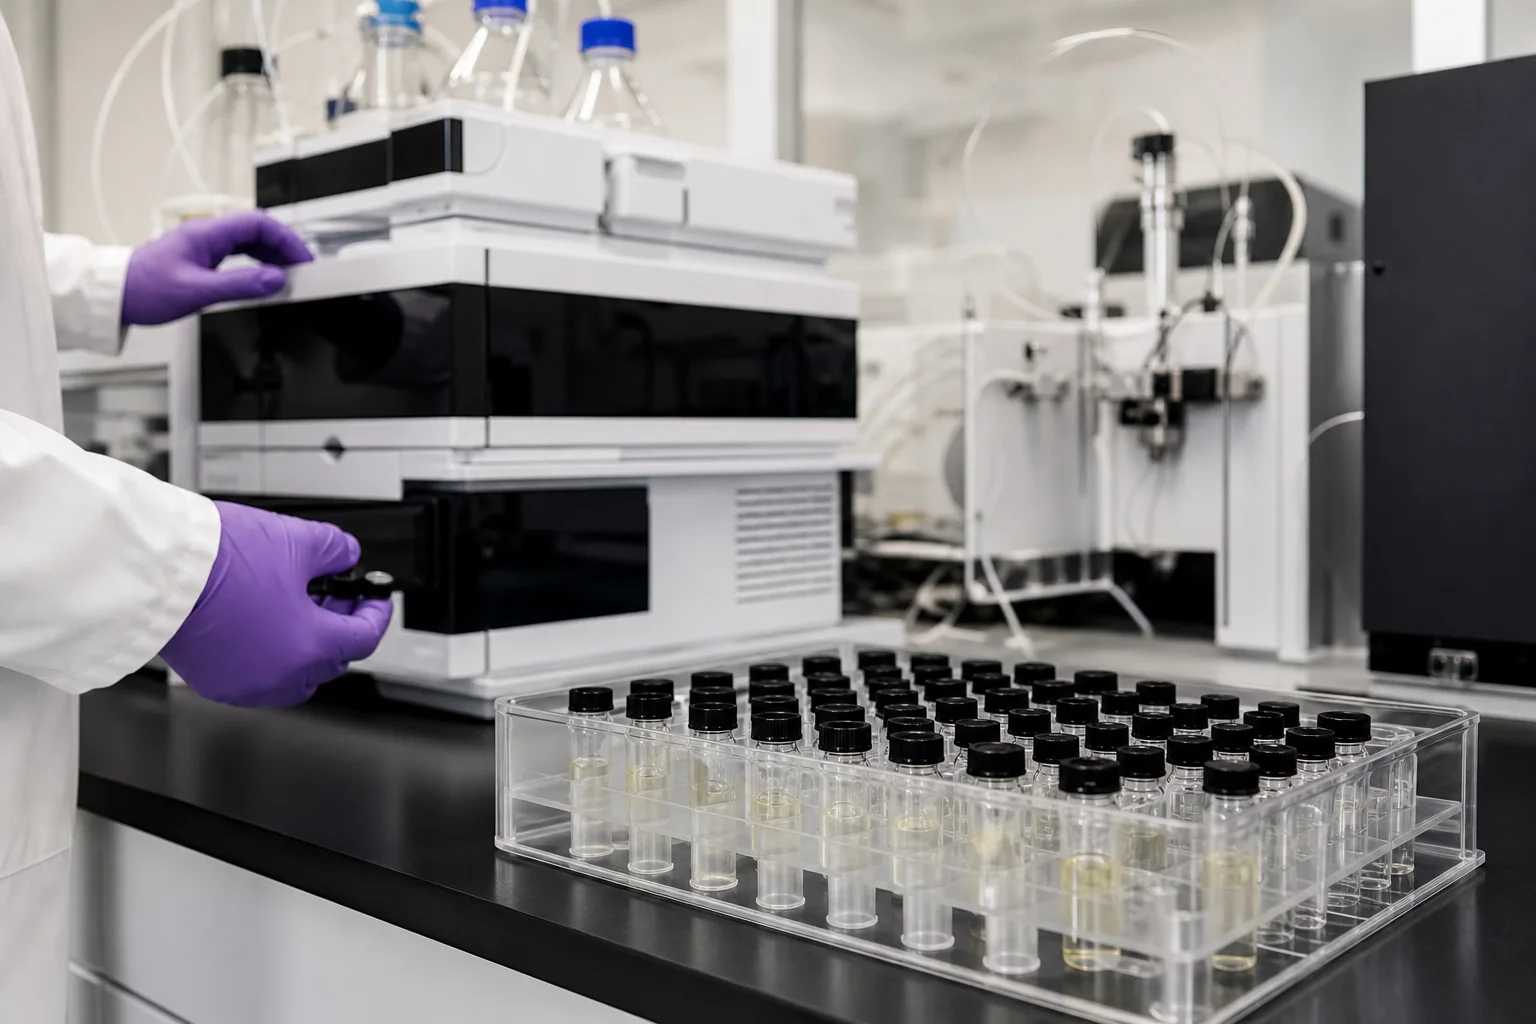
A controlled lab photograph showing instrumentation and a sample tray to illustrate where analytical variability arises (methods, instruments, operator). The image supports discussion of laboratory methods and interlaboratory exercises. No readable instrument screens or COA text.
Research context: NIST Tools for Cannabis Laboratory Quality AssuranceMeasurement uncertainty: why numbers come with error
Every laboratory measurement has uncertainty — a statistical expression of confidence that quantifies how much measured results might vary if the measurement were repeated. Uncertainty is influenced by sample heterogeneity, instrument calibration, operator technique, and matrix effects. Good laboratory practice includes estimating and (where appropriate) reporting uncertainty or method performance metrics, so readers of a COA can see how precise the measurement is. (nvlpubs.nist.gov)
Because potency measurements can vary lab-to-lab, regulators and labs use proficiency schemes and reference materials to characterize typical variabilities for cannabinoids. NIST’s interlaboratory exercises publish aggregated results and method comparisons so stakeholders can understand expected ranges and systematic differences. For consumers, that means a 1–3% absolute difference reported between labs on the same material is not unusual and can reflect method or sampling differences rather than real product inconsistency. (nvlpubs.nist.gov)
Maine’s public testing data underscores why measurement and compliance matter: the state publishes aggregate test data across analyte categories and reports failure rates for contaminants and analytes required by the adult‑use rules. Those mandatory test categories are more than potency — they exist to protect supply-chain integrity and public safety. A single potency percent does not speak to contaminants or pass/fail status in those other analyte categories. (www11.maine.gov)
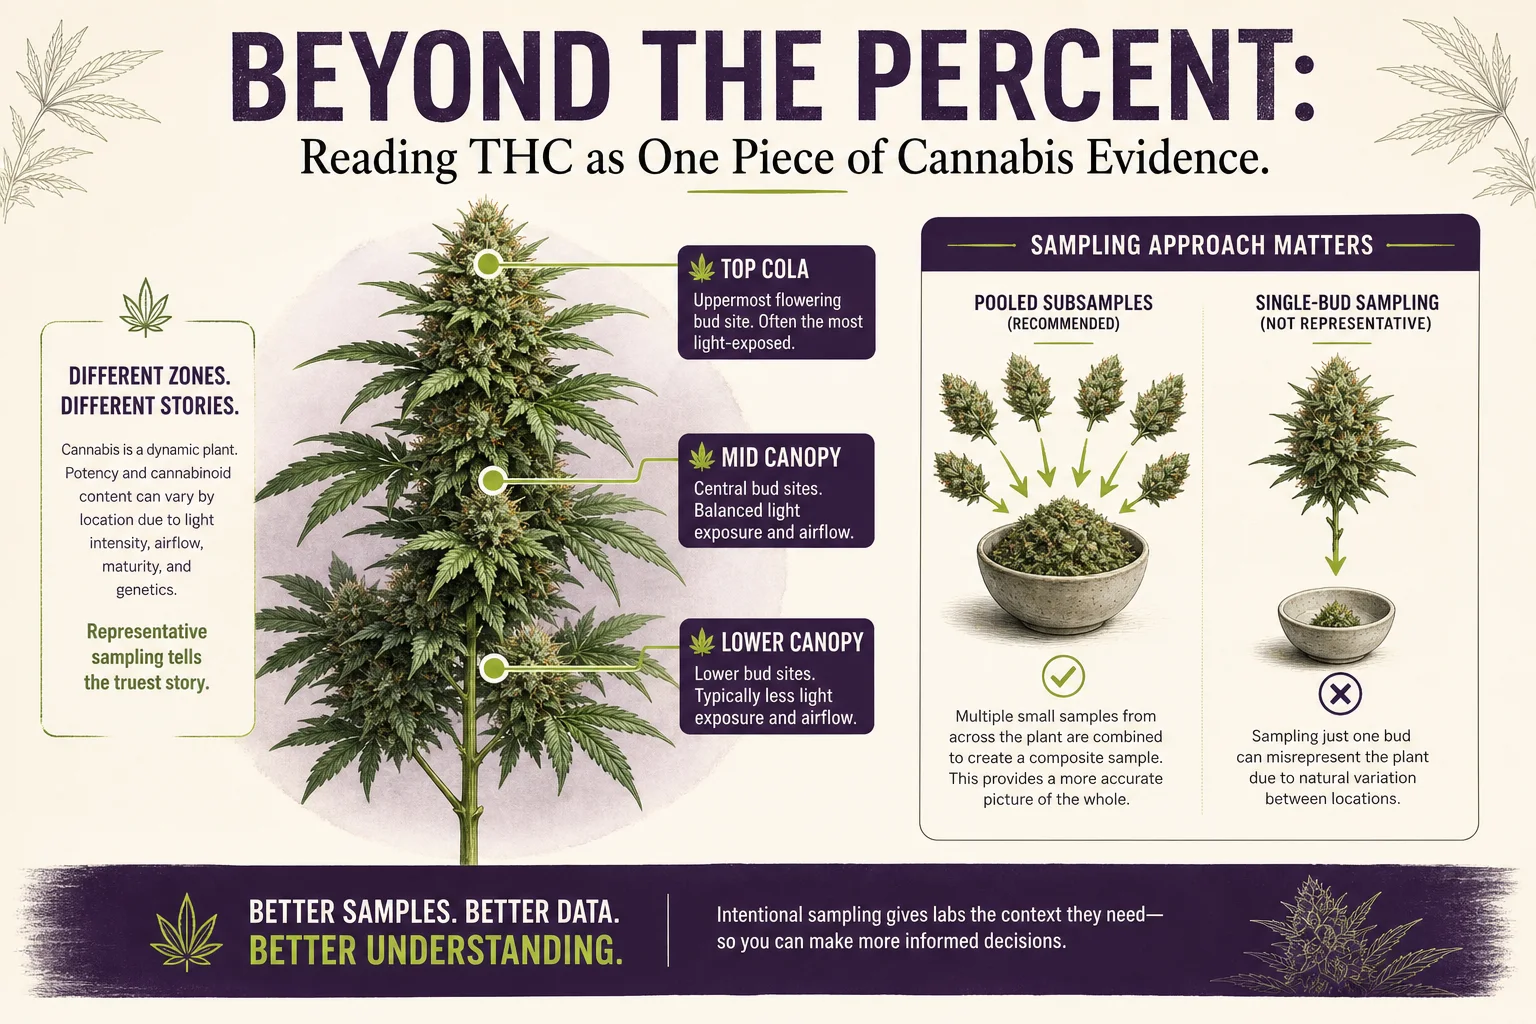
A botanical diagram showing where growers commonly sample on the plant (top colas vs lower nodes) and the difference between pooled/homogenized samples and single‑bud samples. This visual teaches why sampling approach affects reported THC percentage and representativeness.
Research context: OCP Fall 2023 Medical Testing ReportRoute of administration changes what a percent means in practice
THC percentage tells you how much active compound is in a mass of material — but that number does not predict how fast it will act or how long effects might last. Route of administration (inhalation, oral, sublingual, topical) profoundly changes onset, peak, and duration dynamics because absorption pathways, first-pass metabolism, and formulation all matter. Oral products, for example, convert cannabinoids through digestive and hepatic processes that change both timing and metabolic products; inhaled THC is absorbed differently and typically acts faster. The percent number is constant for the tested matrix, but the user experience varies by route. (pubmed.ncbi.nlm.nih.gov)
Product formulation also affects bioavailability. Concentrates, emulsified oils, and edibles can present identical milligram THC values but deliver them into the body at different rates and extents. That is why a percent or milligram figure must be read with the product type and intended route in mind. Avoid interpreting a percent as a direct, ruler‑like predictor of onset or duration. (pubmed.ncbi.nlm.nih.gov)
For growers and educators, this is the practical point: potency is a botanical and analytic descriptor. Making responsible comparisons between product types requires combining that descriptor with information on form, serving size, and method of use. The number alone doesn’t tell the whole story. (nist.gov)
What a THC percentage cannot answer
A single THC percentage cannot tell you: whether the sample contains pesticide residues, heavy metals, or microbial contaminants (those are separate analyte tests in Maine’s adult‑use program); whether terpenes or minor cannabinoids are present in meaningful quantities; which part of the plant the sample came from; or how fresh the product is. Maine’s published data shows testing is multi‑category and that potency is just one mandatory output among several required tests. (www11.maine.gov)
It also cannot tell you how your body will respond. Individual tolerance, prior exposure, metabolism, concurrent substances, and route of administration all influence subjective and objective effects. No percent label can guarantee a specific personal response or safety profile. That’s why COAs, batch records, and transparent sampling notes are important — they help separate measurement from inference. (pubmed.ncbi.nlm.nih.gov)
Finally, a high percent does not automatically mean higher quality. Quality includes cultivation practices, absence of contaminants, terpene profile, post‑harvest handling (drying and curing), and how consistently a producer delivers the expected characteristics from batch to batch. Potency is one measurable axis of many. (nist.gov)
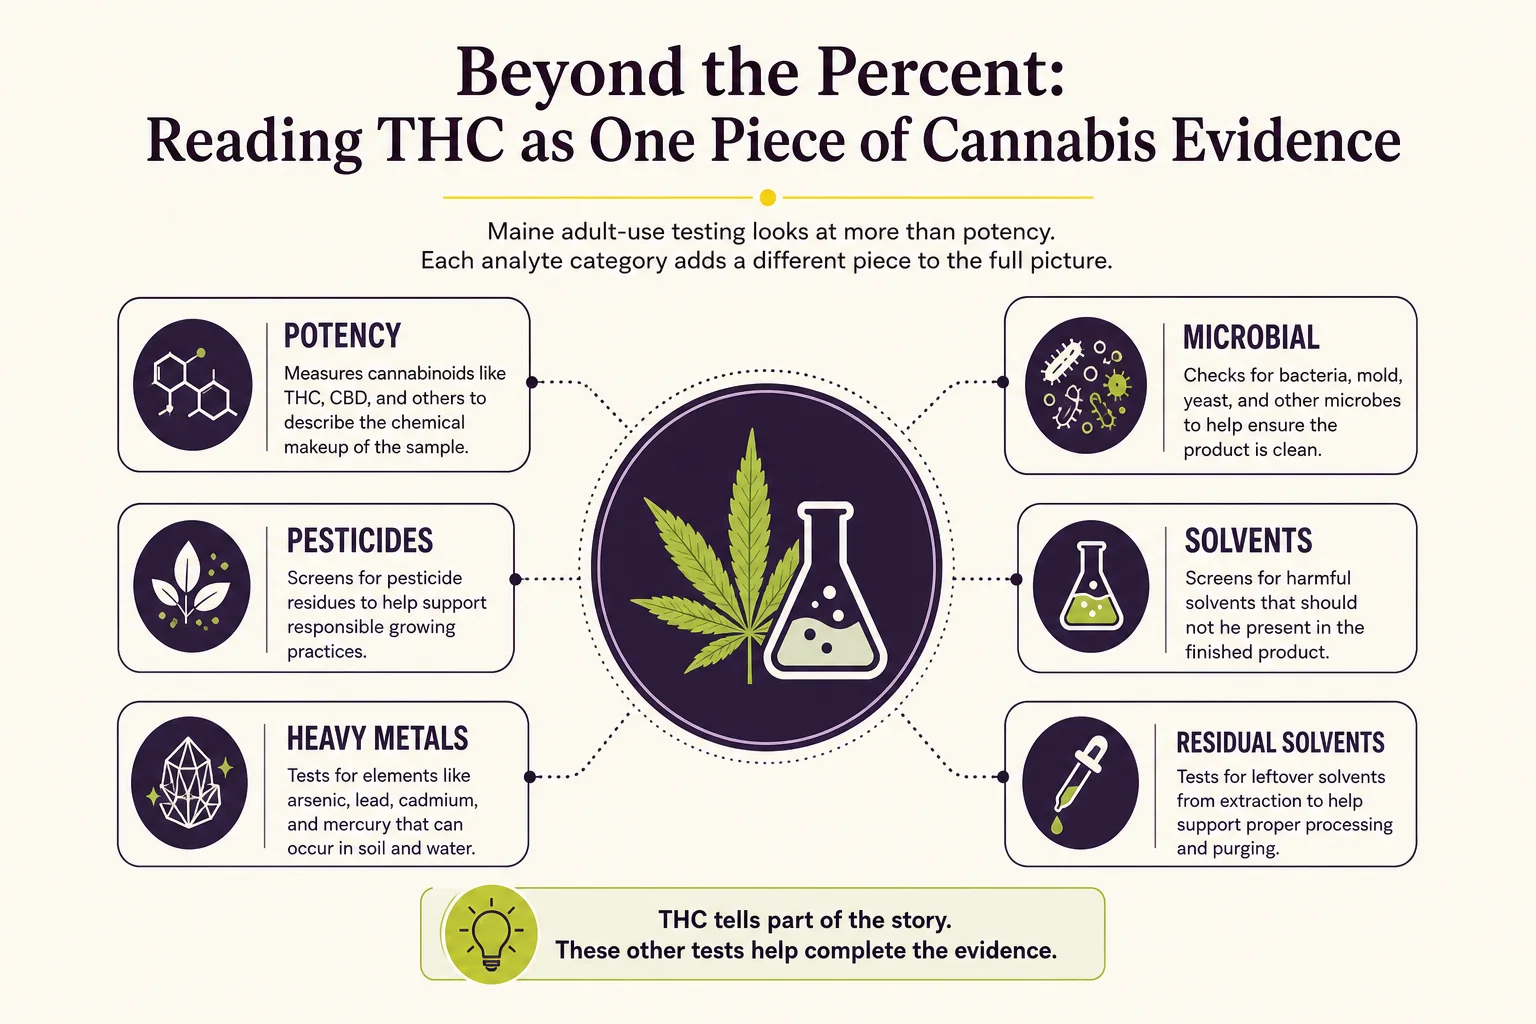
A clear, evidence mapping diagram of Maine’s adult‑use analyte categories (potency among others). This graphic reinforces that potency is one category among multiple mandatory tests and highlights what potency does not reveal. It does not display any lab values or pass/fail marks.
Research context: Adult Use Testing DataQuestions to ask when you see a THC number (reading the COA)
-
Who tested it? Look for the certified testing facility’s name and whether the COA was issued as part of Maine’s required data submission practices. Maine requires issuance of COAs and electronic data deliverables for adult‑use testing; knowing the lab helps gauge method transparency. (www11.maine.gov)
-
What sample type and sampling method were used? Does the COA indicate whether the sample was a consumer, trade, or R&D sample? This affects representativeness. If you’re comparing batches or products, consistent sampling protocols matter. (maine.gov)
-
Which analytes and methods were reported, and is there any uncertainty or method performance data? Good COAs will state whether the result is “total Δ9‑THC,” list analytical methods, and provide method detection limits or precision metrics. Where available, look for links to the lab’s method descriptions or participation in quality programs such as NIST’s CannaQAP. (nvlpubs.nist.gov)
Asking these three practical questions turns a raw percentage into a documented measurement you can interpret sensibly. Producers who document sampling and testing decisions make this process easier and more transparent for retail partners and consumers alike. (www11.maine.gov)
Closing: use percent as data, not a verdict
THC percentage is a measurable, valuable attribute — particularly for growers and lab scientists who use it to monitor harvest timing, extraction yield, and batch consistency. But it is a point estimate: a snapshot that depends on sampling, lab method, matrix, and time. Maine’s public testing data and NIST’s quality resources remind us that measurement quality improves when sampling, reference materials, and interlaboratory comparisons are part of the system. Read the percent, read the COA, ask the right questions, and remember that the number is one carefully measured piece of a larger evidence picture. (www11.maine.gov)
Key takeaways
- THC percent is percent w/w or mg/g measured on a specific tested sample; it’s not an absolute property of a strain. (nvlpubs.nist.gov)
- Sampling and lab method choices influence reported potency; COAs should disclose those details. (maine.gov)
- Measurement uncertainty and inter‑lab variability mean small percent differences may be methodological, not meaningful changes. (nvlpubs.nist.gov)
- Route and formulation change how a measured THC amount behaves in the body; percent alone doesn’t predict onset or duration. (pubmed.ncbi.nlm.nih.gov)
- Potency is one axis of quality; contaminants, terpenes, post‑harvest handling, and consistency also matter. (maine.gov)
Sources reviewed
- Adult Use Testing Data. Maine Office of Cannabis Policy. https://www11.maine.gov/dafs/ocp/open-data/adult-use/testing-data. (OCP aggregate testing data, COA & EDD reporting requirements). (www11.maine.gov)
- Data | Office of Cannabis Policy. https://www.maine.gov/dafs/ocp/open-data. (OCP open data overview and program structure). (maine.gov)
- NIST Tools for Cannabis Laboratory Quality Assurance. National Institute of Standards and Technology. https://www.nist.gov/programs-projects/nist-tools-cannabis-laboratory-quality-assurance. (CannaQAP, reference materials, QA tools). ()
Questions this guide answers
Is a higher THC percent always stronger?
Higher percent means more THC per gram in the tested sample, but strength for a person depends on route, tolerance, and formulation; a number alone doesn’t predict personal effects.
Why do COAs from different labs sometimes disagree?
Differences arise from sampling, extraction, instrument calibration, and method validation. Participation in proficiency programs raises comparability but cannot remove all variation.
What should I look for on a COA besides THC?
Check the lab name, sample type, analyte list (pesticides, metals, microbes), methods used, and any method performance metrics or detection limits to understand completeness and reliability.
What does ‘total Δ9‑THC’ mean?
It typically indicates the laboratory added THCa (using a conversion factor) to measured Δ9‑THC to estimate the potential Δ9‑THC after decarboxylation; check the COA method notes for details.
How can growers improve their representativeness?
Use standardized sampling plans, consistent drying/curing protocols, and work with labs that use reference materials and participate in interlaboratory QA exercises.
Educational information only. Cannabis affects people differently and this is not medical advice.