
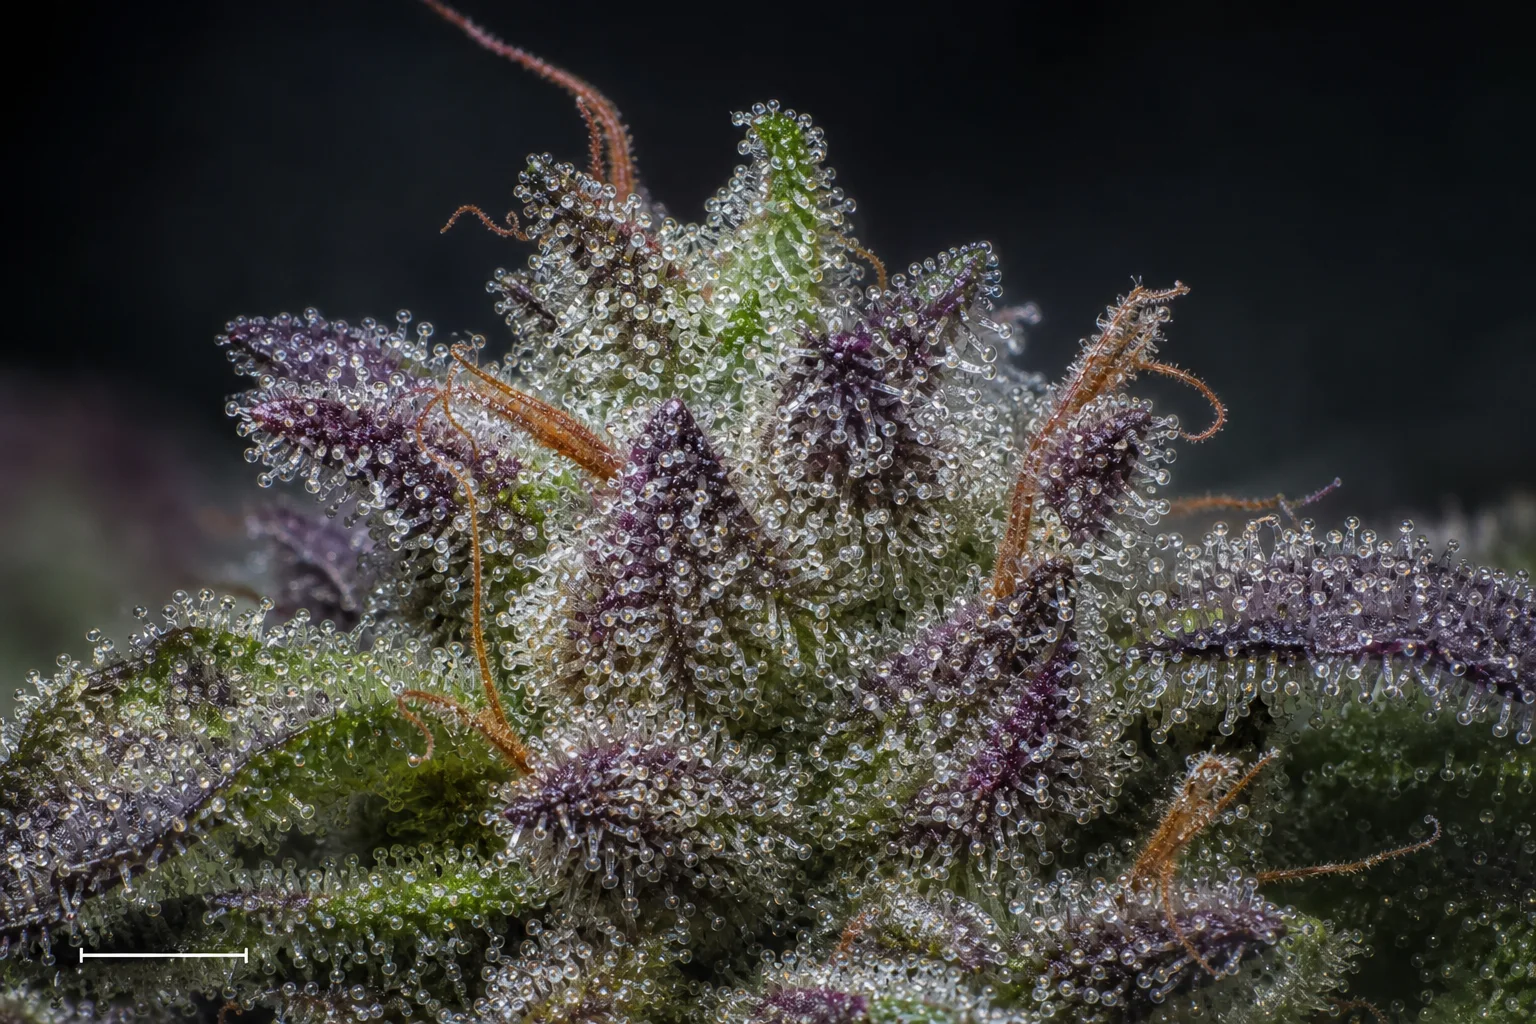
Macro botanical image showing trichome density and gland heads on a flower calyx. This illustrates where THC concentrates in the plant and why sampling (which part of the flower or plant you test) matters. Photo is a documentary-style scientific macro; it does not depict a lab result or readable label.
Introduction
THC percentage is the number most shoppers notice on a cannabis package: bold, simple, and persuasive. But if you grow cannabis, run a small-batch garden, or want to make more informed choices as an adult consumer in Maine, it helps to know what that number actually means—and what it doesn’t. This article walks through what potency measurements are, how laboratories produce them, the limits and uncertainty around those results, and the many questions a single percentage cannot answer. It draws on Maine’s own testing program, laboratory quality work at NIST, federal efforts to standardize THC reporting, and public-health guidance about routes and effects. (maine.gov)
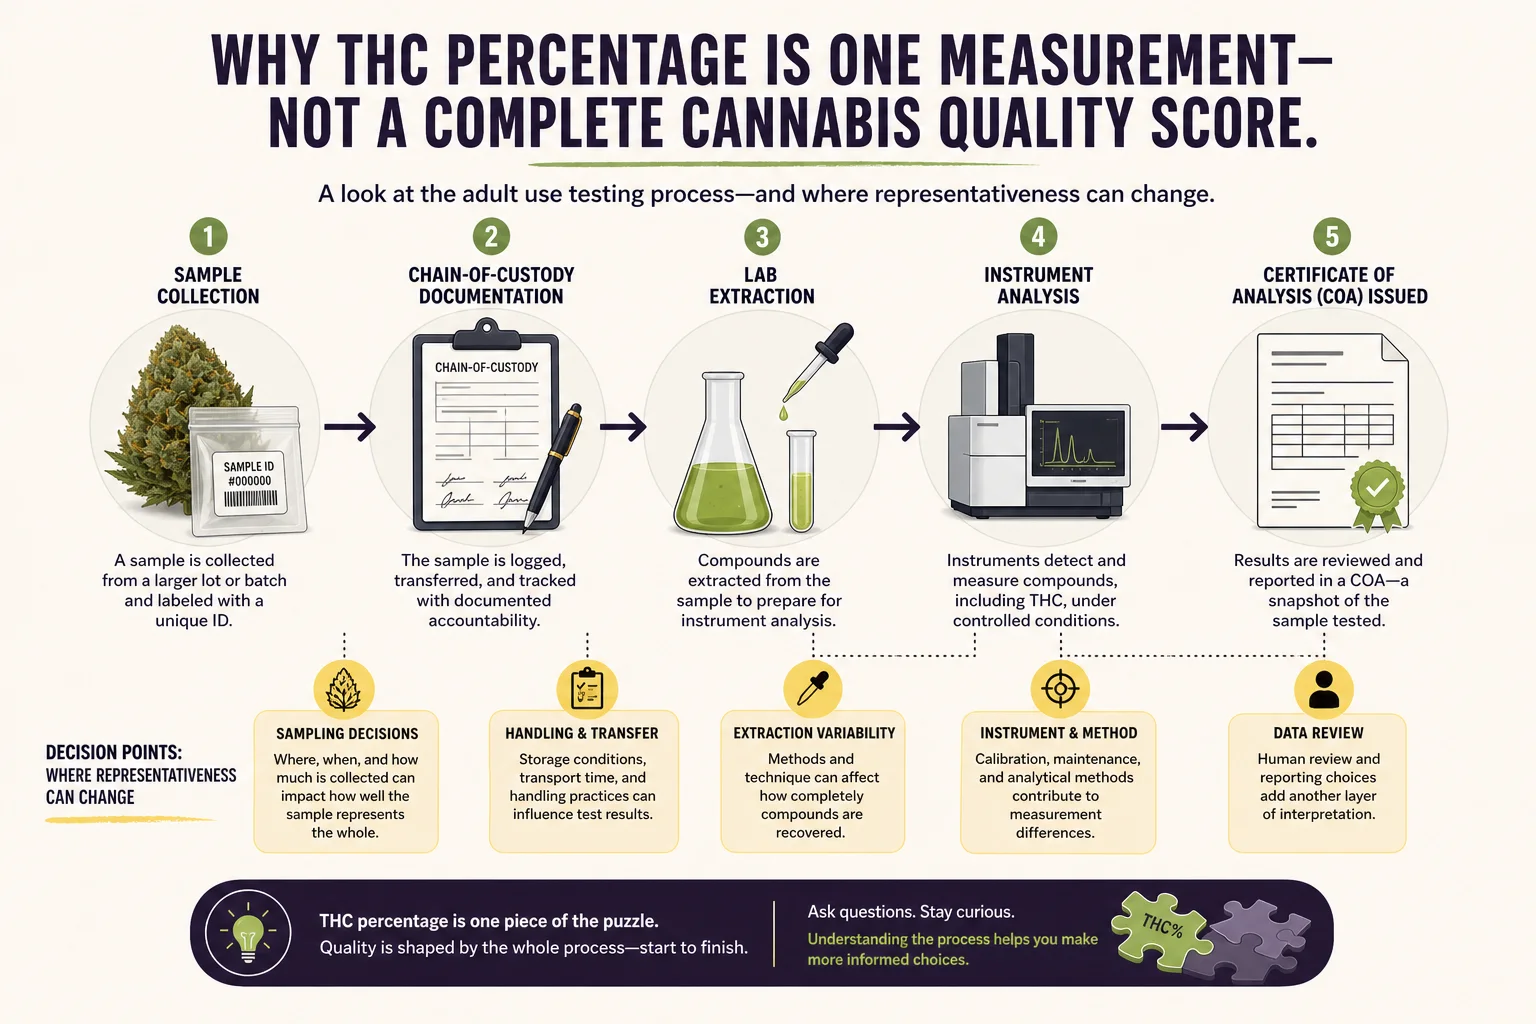
An evidence diagram of sample workflow from collection through COA issuance. It teaches how sample origin and chain-of-custody affect the representativeness of a potency number. Diagram is explanatory and does not show any readable COA values.
Research context: Adult Use Testing DataWhat “THC percentage” actually measures
When a lab reports “THC%” on a Certificate of Analysis (COA), it’s reporting an analytical measurement: milligrams of delta-9-tetrahydrocannabinol per gram of material, expressed as a percent by weight. For flower, that number is commonly measured after sample preparation and extraction and presented as a percent of the dry sample. Different labs may use slightly different assays and calculators (for example whether they report only delta-9-THC or “total THC” that includes converted acidic forms), so the reported value is a lab-derived estimate, not a physical property you can see with the naked eye. (nist.gov)
Those percentages are useful for comparing samples in a narrow sense—they tell you how much THC was in the sample the lab received. But potency is one axis of quality, not the whole map. How the plant was grown, when it was harvested, how it was dried and cured, and how the sample was taken for testing all shift the value behind the percentage. Maine’s adult-use testing program considers potency as one mandatory category among several analyte categories that together inform product safety and labeling. (maine.gov)
Units and the “standard THC unit” problem
Analytical labs report concentration by weight (mg/g or % w/w) or by volume for extracts. Researchers and regulators have sought a common exposure unit to make studies and guidance comparable. The NIH has encouraged adoption of a single "standard THC unit" for research to help compare effects across routes and product types, because the same milligrams have different outcomes depending on how a person consumes them. That work highlights a core point: numbers measured in the lab (concentration) do not directly equal the dose a person receives. Route, formulation, and user factors all change the result. (grants.nih.gov)
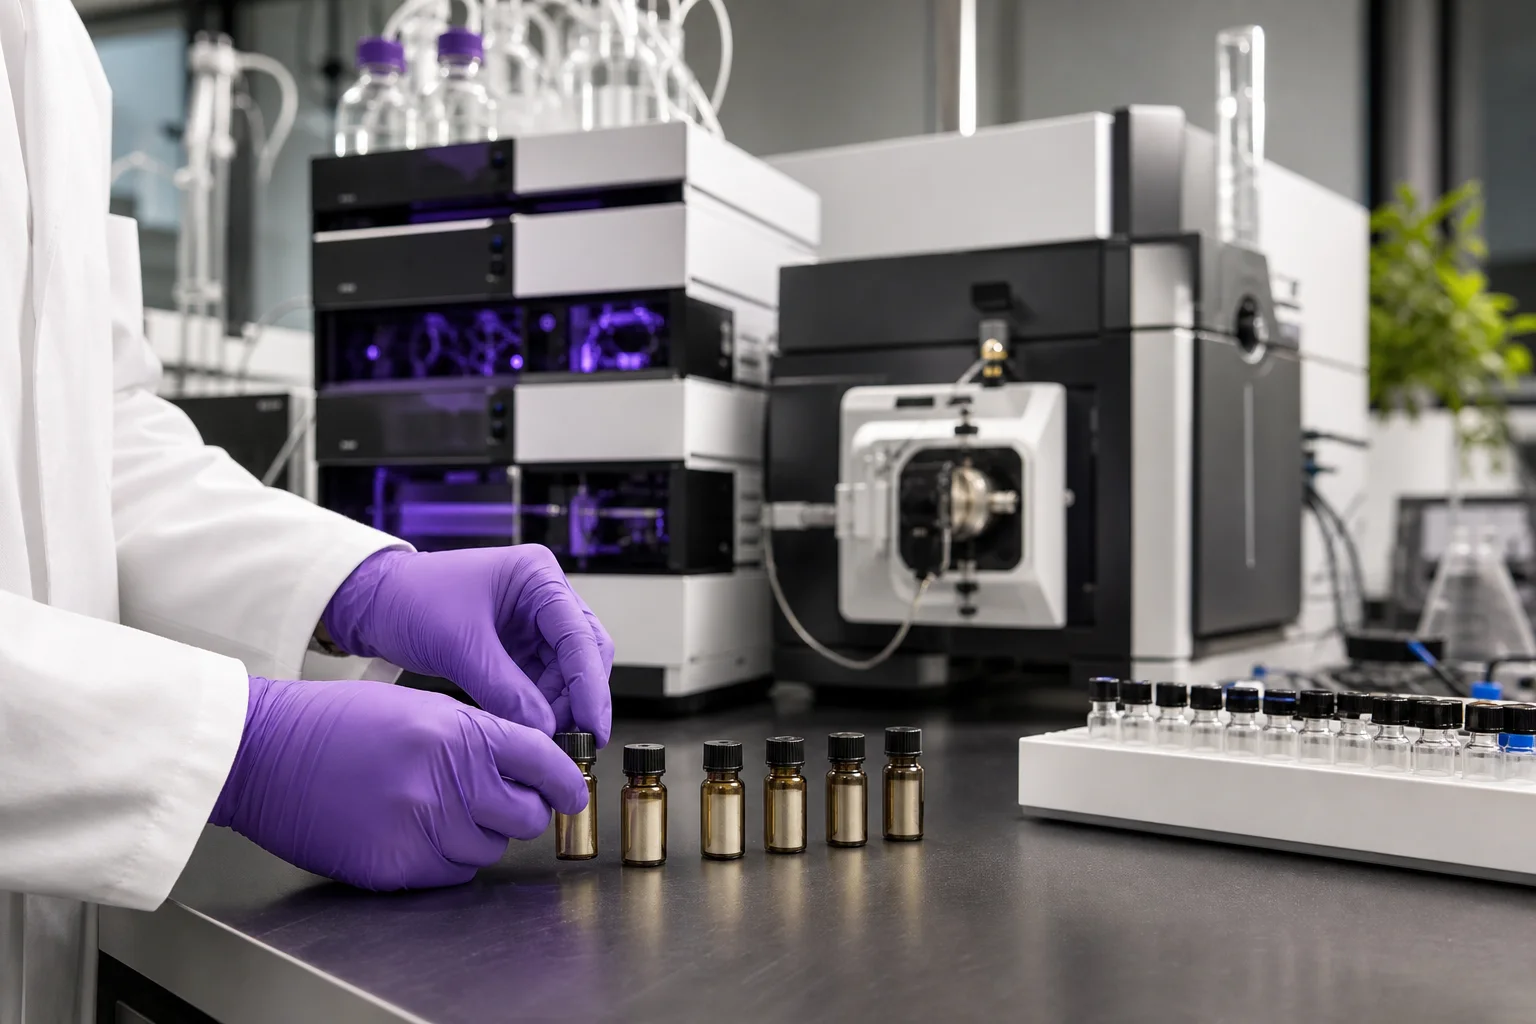
Laboratory context image showing instruments used in cannabinoid quantification and sealed reference material vials. This connects to NIST’s role in providing reference materials and proficiency studies. The image does not show readable instrument screens or sample IDs.
Research context: NIST Tools for Cannabis Laboratory Quality AssuranceSampling, certificates, and the chain of custody
A COA is only as meaningful as the sample it describes. In regulated programs such as Maine’s, laboratories receive samples that have been collected according to program rules; they analyze those samples and issue COAs and electronic data deliverables. But the sample tested may not be representative of the whole batch on the shelf. Labs flag homogeneity (or the lack of it) when required; retesting is allowed in limited circumstances under Maine’s rules. That’s why OCP emphasizes mandatory testing categories beyond potency—contaminants and homogeneity matter for safety and correct labeling. (maine.gov)
A COA tells you about the specific test sample, not necessarily every jar, bag, or vape cartridge produced under the same label. Producers and retailers who value consistency build sampling and batch-tracking into their workflows; small-batch growers may expect some variability from plant to plant and trim to trim. (maine.gov)
Measurement uncertainty and laboratory quality assurance
Every analytical result has uncertainty. Precision, accuracy, and comparability depend on the method used, reference standards, instrument calibration, sample prep, and the lab’s competence. NIST’s Cannabis Laboratory Quality Assurance Program (CannaQAP) and development of natural-matrix reference materials are specifically intended to help laboratories demonstrate and improve measurement comparability across the field. Participation in proficiency studies and use of reference materials reduce—but do not eliminate—variation between labs. When laboratories report a THC percentage, that value implicitly carries method-specific uncertainty that most labels don’t show. (nist.gov)
Practical implication: a 20% result from Lab A may not be directly interchangeable with a 20% from Lab B. For regulators and researchers, interlaboratory studies and reference materials are how measurement comparability is improved; for consumers, it’s a cue to regard percentages as directional rather than absolute.
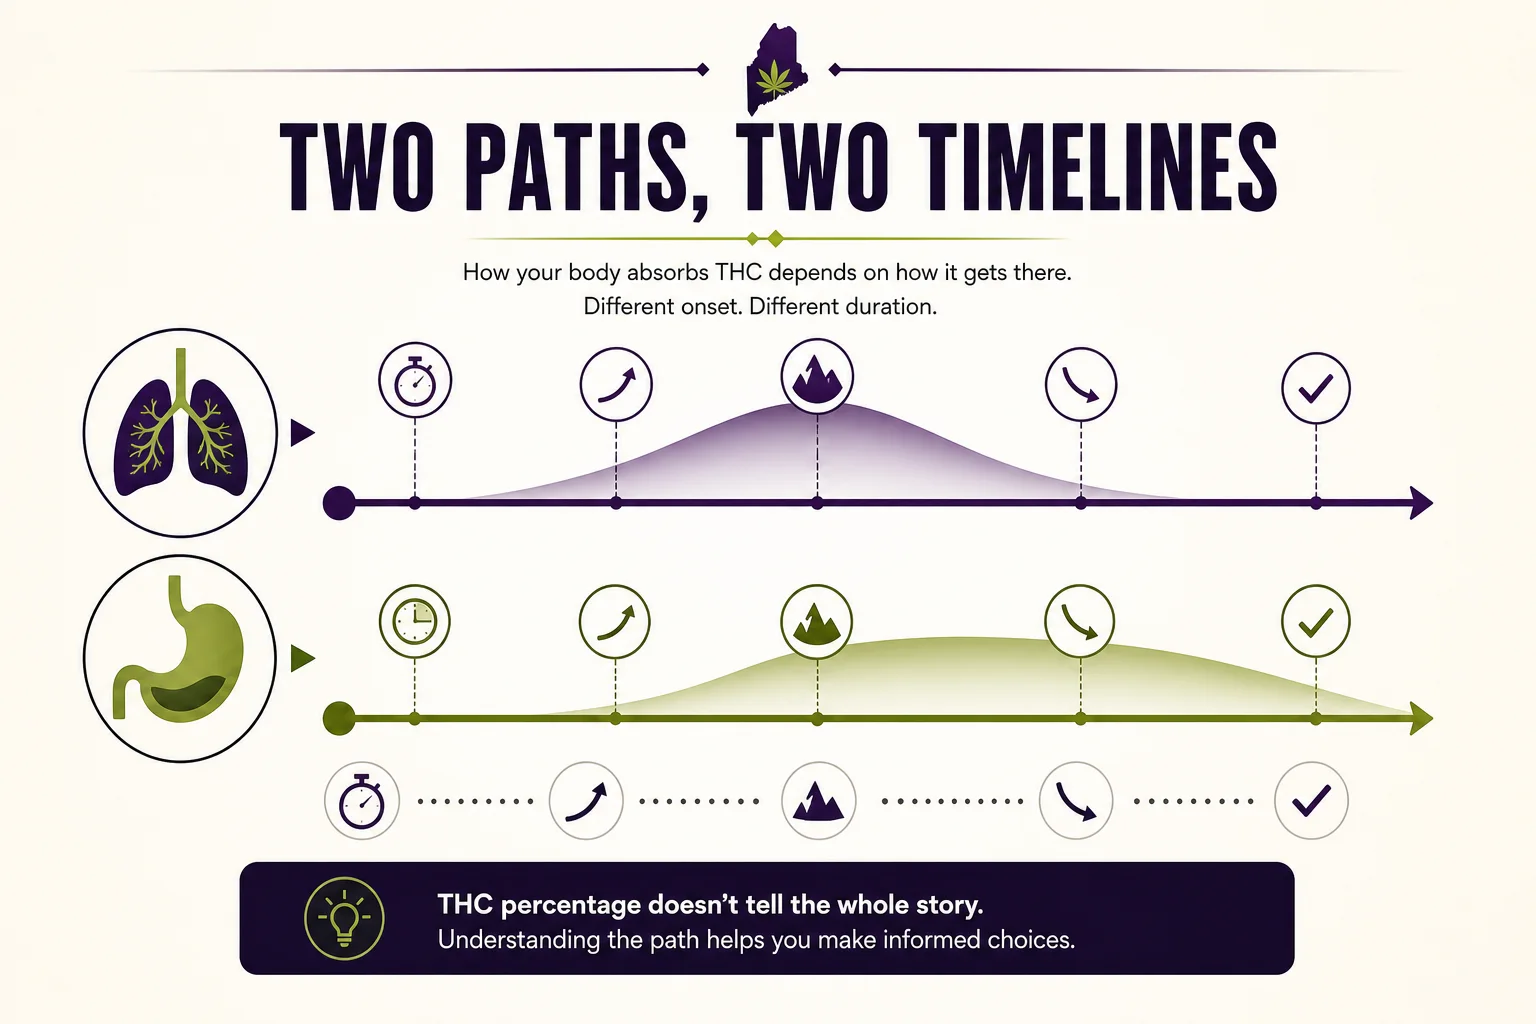
An explanatory diagram comparing inhalation and ingestion in terms of onset and duration. It uses conceptual timelines to show why identical THC milligrams can lead to different exposure profiles. Not a dosing guide; no numeric dosing labels.
Research context: NOT-DA-21-049: Establishment of a Standard THC Unit to be used in Research · About CannabisRoute of administration and pharmacokinetics: why the number doesn’t predict experience
How someone consumes cannabis alters how much THC reaches the bloodstream, how fast, and for how long. Smoking and vaping deliver THC quickly because the lungs absorb it efficiently; edibles and many oral formulations produce a delayed and sometimes more variable rise in blood levels due to digestion and liver processing. The NIH’s push for a standard THC unit recognizes this complexity: identical milligrams have different pharmacologic profiles depending on route, formulation, and user factors such as prior exposure and metabolism. Public-health guidance from CDC likewise emphasizes that high-concentration products or ingestible formats can have delayed and unpredictable effects—this is about exposure and timing, not a judgment of quality. (grants.nih.gov)
When choosing a product, a useful question is not just “what percent THC?” but “what format is it, and how might that alter onset and duration?” That question is especially relevant for people who are new to high-concentration products or who are changing routes (for example, moving from flower to edibles).
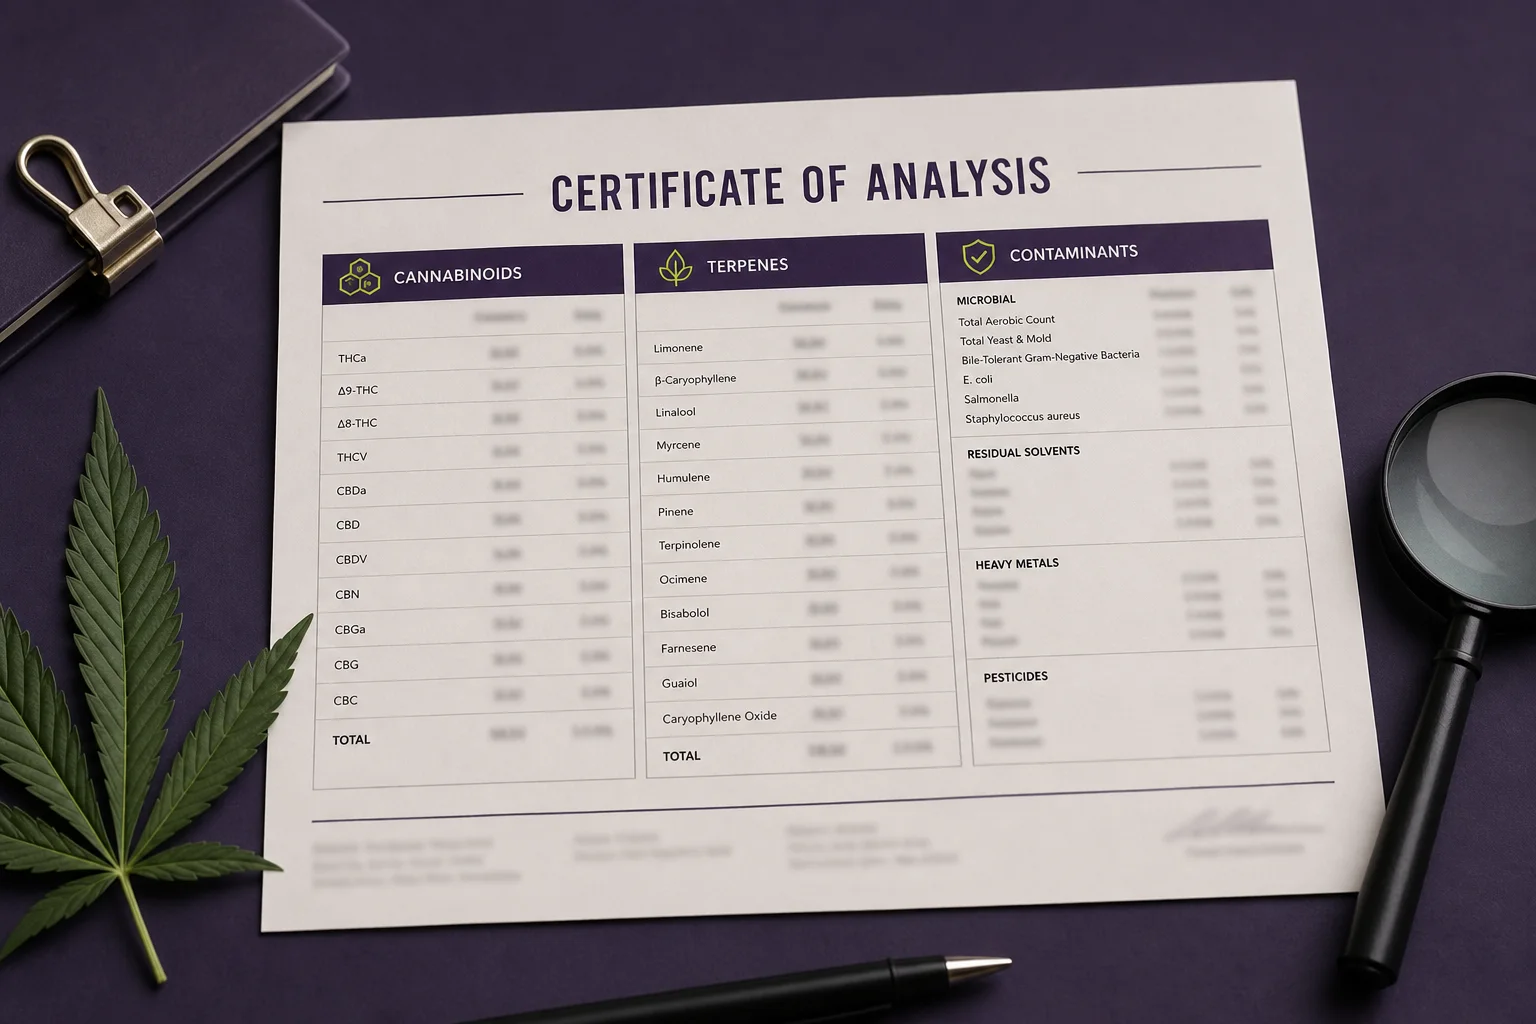
Photograph of a COA printed page with all numeric results and lab identifiers blurred; this teaches readers where to look on a COA (THC metric, cannabinoids list, contaminant panels) while protecting privacy and avoiding specific values.
Research context: Cannabis Laboratory Quality Assurance Program: Exercise 2 Cannabinoid Final Report (NIST IR 8519)What THC percentage does not tell you
A single percentage cannot answer many fundamental consumer questions:
- Safety from contaminants (pesticides, molds, solvents): potency says nothing about chemical or microbiological contaminants; Maine requires testing of these categories before sale. (maine.gov)
- Homogeneity (is the product consistent from unit to unit?): sampling and testing protocols aim to detect heterogeneity, but a single COA may come from a single sample. (maine.gov)
- Terpene profile and minor cannabinoids: the bouquet of terpenes and ratios of CBD, CBG, or others shape aroma and can influence subjective profiles; a percent-THC label alone ignores these features. Lab panels can and often do report these, but the big bold percent does not. (nvlpubs.nist.gov)
- Freshness, moisture content, and curing quality: drying and curing change aroma and combustibility and can alter measured potency through degradation—again, not captured by the single number. NIST work on moisture and matrix reference materials highlights how sample state affects measurements. (nvlpubs.nist.gov)
Taken together, those blind spots explain why many of us who grow and sample cannabis prefer a broader picture: a COA with cannabinoids, terpene markers, homogeneity notes, moisture, and contaminant screens offers a much richer view than the percentage alone.
Maine’s adult-use vs. medical systems: why program context matters
Maine maintains both adult-use and medical programs with different participant mixes and reporting subsets. The Office of Cannabis Policy publishes separate data sets and enforces mandatory testing categories for adult-use products; medical programs historically serve a different population with different labeling and access pathways. When reading potency and safety data, it helps to know which program the product was tested under because sampling rules, allowed product types, and retest allowances can differ. Maine compiles its adult-use aggregate testing results quarterly so regulators and growers can see failure rates and trends across analyte categories, not just potency. (maine.gov)
How growers, retailers, and consumers can use potency responsibly
For growers and small-batch cultivators
THC percentage is one quality indicator among many. Growers often track batches, note harvest dates and drying/curing regimens, and sample multiple flowers across a batch when a truer mean for the crop is desired. Some producers choose labs that participate in proficiency testing and use reference materials—this improves comparability. NIST’s CannaQAP and natural-matrix reference materials are designed to help labs and producers work toward consistent measurement. (nist.gov)
For consumers
Percent-THC can serve as a quick orientation to potency; COAs provide context beyond the bold percentage. COAs may report whether they show total vs. delta-9 THC, include terpene listings that speak to aroma and sensory profile, and confirm that contaminant screens were performed. Route of use changes exposure—edibles and concentrates can produce different onset and duration profiles than smoked flower even when lab-measured percentages are similar. (maine.gov)
Reading a COA: a short checklist
- Who analyzed the sample? Check the lab name and accreditation information.
- Which THC metric is reported? Delta-9 THC vs. total THC (includes decarboxylated acid forms).
- Are other cannabinoids and terpenes listed? These add context to the expected sensory and subjective profile.
- Do contaminant screens (pesticides, heavy metals, microbes, solvents) pass? Potency means little if safety checks failed.
- Is there a sample ID and batch reference that matches the product packaging? That helps confirm representativeness. (maine.gov)
Evidence limits and what we still need to know
The published programs and NIST work improve measurement comparability but don’t erase uncertainty. Interlaboratory variability persists, and many consumer-facing labels don’t show measurement uncertainty, sampling protocols, or expiration—from which additional variability is inferred. Research-standard units are a helpful direction for epidemiology and regulatory comparisons, but they don’t eliminate the need to consider route, formulation, and individual variability in response. Regulators and researchers are steadily improving the tools; for now, the pragmatic view is to regard THC percentage as informative but incomplete. (nist.gov)
Conclusion
THC percentage is a useful, lab-based snapshot of a tested sample’s potency. It is not a complete quality score because it says nothing about contaminants, homogeneity, terpenes, storage, route of administration, or lab-specific uncertainty. The state of Maine requires potency testing as one element of a broader safety framework—percentages are most informative when considered alongside contaminant tests and COA metadata. For growers and buyers in Maine, COAs are typically available; evaluating the COA and the product’s format in the context of sampling and route of use can provide a clearer picture of what that number represents.
Key takeaways
- THC% is an analytic concentration (mg/g or % weight)—useful, not definitive. (nist.gov)
- Lab results carry method-specific uncertainty; reference materials and proficiency programs improve comparability. (nist.gov)
- A COA describes the tested sample; it may not represent every unit from the same batch. (maine.gov)
- Route of administration changes exposure; identical THC mg may behave very differently when inhaled vs. eaten. (grants.nih.gov)
- Check contaminant screens, homogeneity notes, terpenes, and COA metadata—not just the big percentage.
- Maine’s adult-use rules require multiple analyte tests; potency is mandatory but part of a broader safety framework.
FAQs
Q: Is higher THC% always “better”?
A: No. Higher THC indicates greater lab-measured potency in the sample tested, but does not imply safety, consistency, or a preferable experience. Consider terpenes, other cannabinoids, and product format. (nvlpubs.nist.gov)
Q: Can labs inflate THC percentages? How do I know a COA is honest?
A: Accredited labs follow validated methods, but interlaboratory variability exists. One indicator of laboratory reliability is participation in proficiency testing and the use of reference materials; Maine’s adult-use program requires COAs and reporting. (maine.gov)
Q: Why don’t labels show uncertainty ranges for THC%?
A: Labels generally show point estimates; adding uncertainty ranges complicates packaging. Regulators and researchers are focused on improving comparability and transparency, but consumer labels rarely include statistical uncertainty. (nist.gov)
Q: Are products with declared terpenes more informative than those with only THC%?
A: If aroma, sensory profile, or nuanced subjective characteristics matter, terpene data provide context that a THC percentage alone cannot. COAs that list cannabinoids and terpenes provide additional information. (nvlpubs.nist.gov)
Q: Does Maine test for contaminants as well as potency?
A: Yes. Maine’s adult-use program mandates testing across multiple analyte categories, including pesticides, metals, microbes, mycotoxins, solvents and potency/homogeneity. OCP’s testing data and the COA are sources for those results. (maine.gov)
Q: Do small growers test every batch?
A: Testing every batch can improve transparency and consistency, but producers often balance sampling strategy with cost. Many producers test representative samples from multiple plants and track harvest and curing parameters.
Sources
- Adult Use Testing Data. Maine Office of Cannabis Policy. https://www.maine.gov/dafs/ocp/open-data/adult-use/testing-data. (maine.gov)
- NIST Tools for Cannabis Laboratory Quality Assurance. NIST. https://www.nist.gov/programs-projects/nist-tools-cannabis-laboratory-quality-assurance. (nist.gov)
- Cannabis Laboratory Quality Assurance Program: Exercise 2 Cannabinoid Final Report (NIST IR 8519). https://nvlpubs.nist.gov/nistpubs/ir/2024/NIST.IR.8519.pdf. (nvlpubs.nist.gov)
- NOT-DA-21-049: Establishment of a Standard THC Unit to be used in Research. NIH. https://grants.nih.gov/grants/guide/notice-files/NOT-DA-21-049.html. (grants.nih.gov)
- About Cannabis. CDC. https://www.cdc.gov/marijuana. (cdc.gov)
Visual briefs
[ {"role":"hero","after_section":-1,"alt":"Macro photograph of cannabis flower trichomes showing glandular heads where cannabinoids concentrate","caption":"Macro botanical image showing trichome density and gland heads on a flower calyx. This illustrates where THC concentrates in the plant and why sampling (which part of the flower or plant you test) matters. Photo is a documentary-style scientific macro; it does not depict a lab result or readable label.","prompt":"Documentary botanical macro photograph: close-up of cannabis flower showing trichomes and gland heads on calyxes, scale bar (non-readable), natural lighting, high-resolution, depth-of-field to show gland structure; educational, non-branded, non-consumptive.","source_urls":["https://www.maine.gov/dafs/ocp/open-data/adult-use/testing-data"]},
{"role":"section","after_section":0,"alt":"Annotated diagram explaining lab sample flow: collection, chain-of-custody, extraction, analysis, COA","caption":"An evidence diagram of sample workflow from collection through COA issuance. It teaches how sample origin and chain-of-custody affect the representativeness of a potency number. Diagram is explanatory and does not show any readable COA values.","prompt":"Clean infographic/diagram showing steps: sample collection (with sample ID), chain-of-custody form, lab extraction, instrument analysis, certificate of analysis (COA) issuance; emphasize decision points where representativeness can change; neutral color palette, legible annotations, no logos or real data.","source_urls":["https://www.maine.gov/dafs/ocp/open-data/adult-use/testing-data"]},
{"role":"section","after_section":2,"alt":"Photograph inside an analytical lab showing HPLC/LC-MS instruments and reference material vials","caption":"Laboratory context image showing instruments used in cannabinoid quantification and sealed reference material vials. This connects to NIST’s role in providing reference materials and proficiency studies. The image does not show readable instrument screens or sample IDs.","prompt":"Documentary photograph of an analytical chemistry lab: LC-MS or HPLC instruments in the background, technician gloved hands placing sealed reference material vials on a bench; focus on instruments and RM vials, avoid showing readable text or lab logos.","source_urls":["https://www.nist.gov/programs-projects/nist-tools-cannabis-laboratory-quality-assurance"]},
{"role":"section","after_section":4,"alt":"Comparative diagram of routes of administration showing relative onset/duration for inhalation vs ingestion","caption":"An explanatory diagram comparing inhalation and ingestion in terms of onset and duration. It uses conceptual timelines to show why identical THC milligrams can lead to different exposure profiles. Not a dosing guide; no numeric dosing labels.","prompt":"Educational timeline diagram: two parallel lanes comparing inhalation (fast onset, shorter duration) and ingestion (delayed onset, longer duration), use icons for lung and stomach, clear non-numeric timelines; neutral educational tone.","source_urls":[""]},
Questions this guide answers
Is a higher THC% safer or more effective?
No. Higher THC indicates greater lab-measured potency in the tested sample but does not guarantee safety, consistency, or a preferable experience. Consider contaminants, homogeneity, terpenes, and product format.
How can I tell if a COA is trustworthy?
Trusted COAs come from accredited labs that participate in proficiency testing and use reference materials. Look for sample IDs, batch references, and complete contaminant panels on the COA.
Does Maine require testing beyond potency?
Yes. Maine’s adult-use testing program mandates analyte categories including pesticides, metals, microbes, mycotoxins, solvents, and potency/homogeneity before sale. Check the OCP testing data and the COA for details.
Why do identical THC milligrams feel different in edibles vs smoked flower?
Route of administration changes absorption and metabolism. Inhalation gives quicker onset and higher early blood levels; ingestion has delayed and often more variable onset because of digestion and liver metabolism.
Should small growers test every batch?
Testing every batch improves transparency and consistency, but producers often balance sampling strategy with cost. When possible, test representative samples from multiple plants and track harvest and curing parameters.
Educational information only. Cannabis affects people differently and this is not medical advice.