
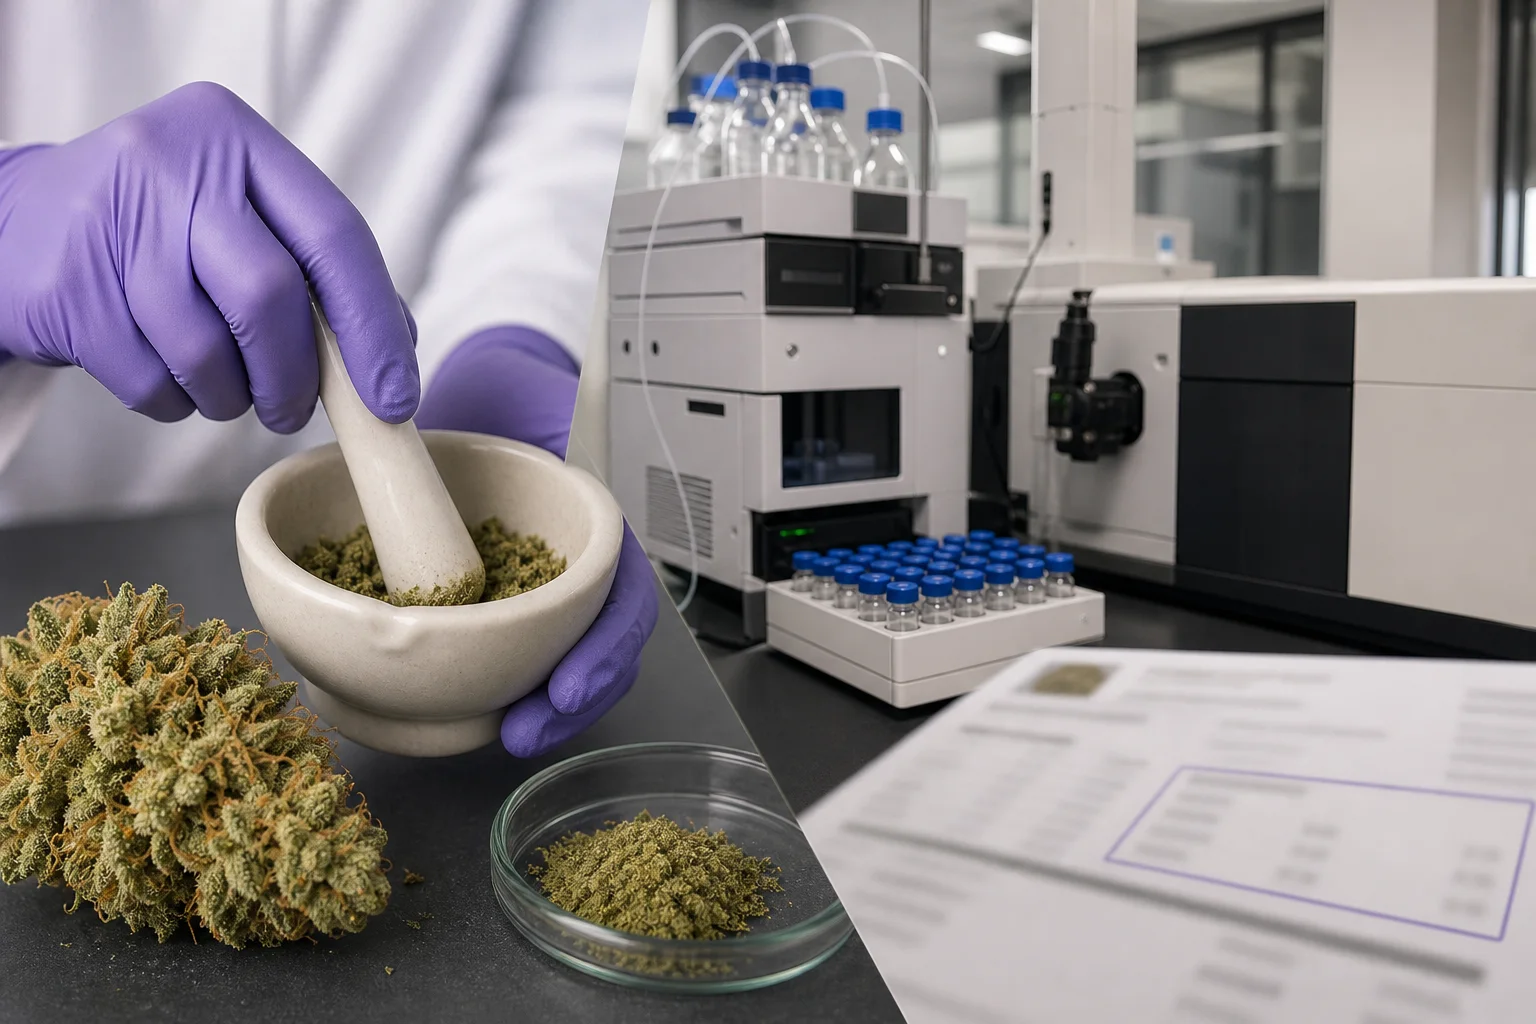
Hero composite showing the three stages that produce a THC percent: representative sampling, instrumental analysis, and the certificate of analysis. This illustrates the article’s central claim that a percent is the output of a chain of evidence with limits. The image should avoid legible COA text and numbers to prevent misreading. Source documents inform the visual but do not supply readable statistics.
Introduction: the number you see and what people expect
Walk into a shop or scan a menu and one of the boldest claims is usually a THC percentage: 18%, 24%, 32% — a single tidy number that promises potency at a glance. For growers, budtenders, and curious consumers alike, that number is a useful shorthand. It’s also an incomplete piece of evidence: it tells you the concentration of certain cannabinoids in the sample that was tested, not the full story about quality, safety, effect, or how the plant was grown. Maine’s adult‑use program lists potency as one mandatory category among several required tests; it’s deliberately not the only metric regulators require. (maine.gov)
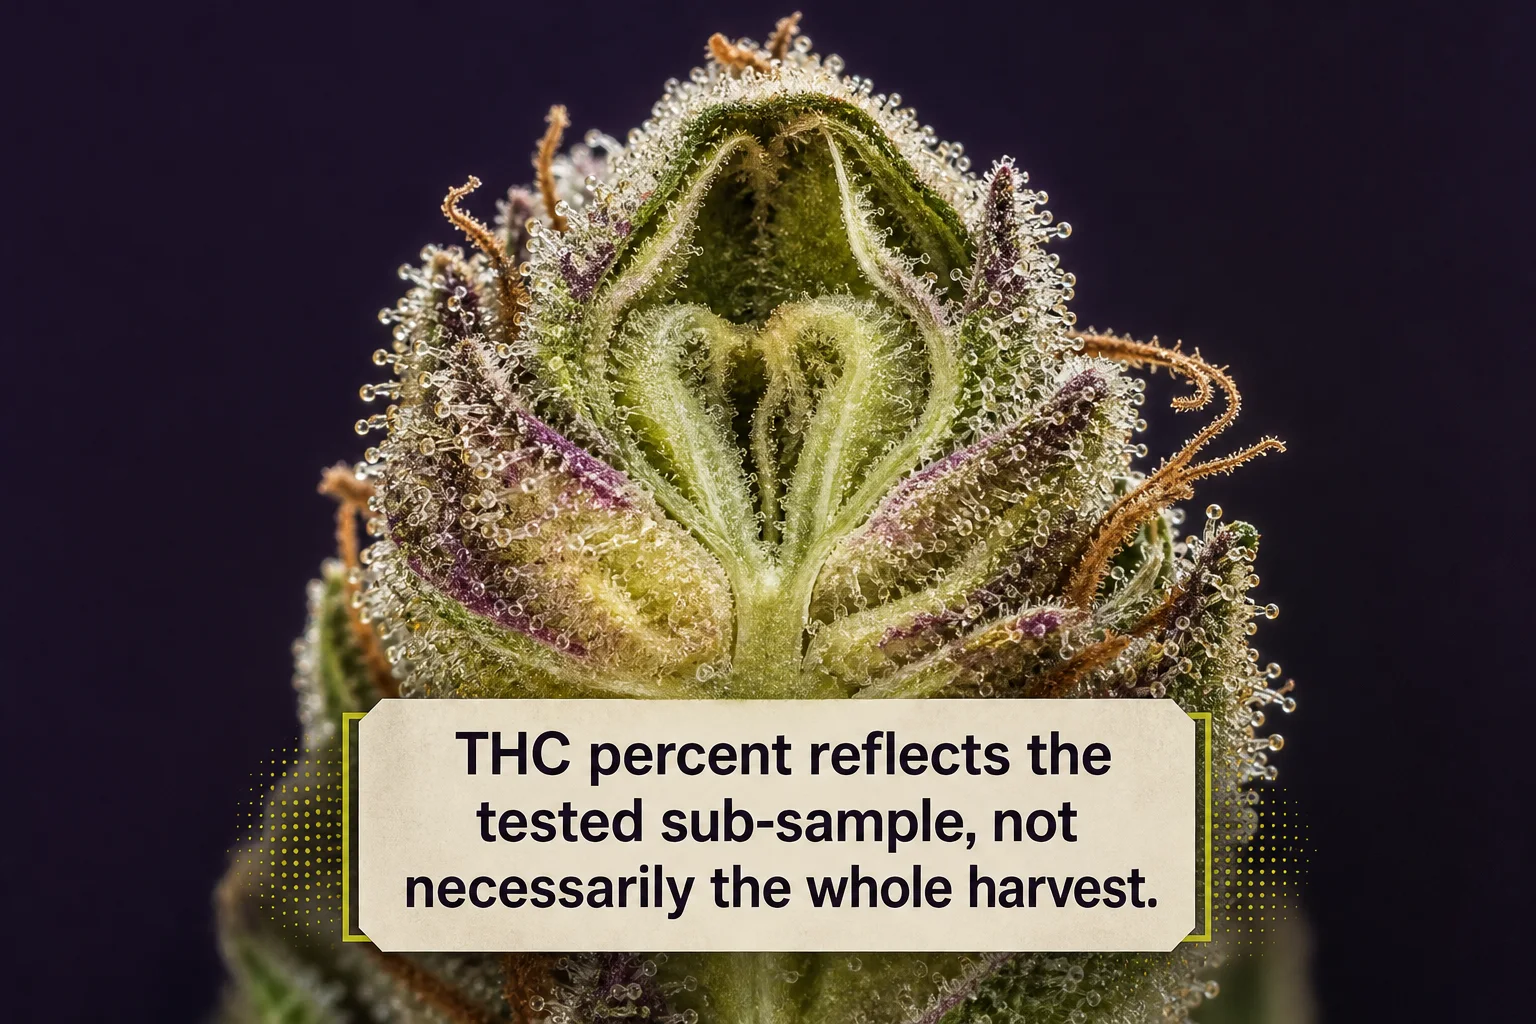
A botanical macro illustrating why a single sample can misrepresent a batch: trichome density varies across a plant and among nugs, so the tested sub‑sample drives the reported THC percent. Use this to teach sampling limits. Limit: photo shows a single bud and cannot prove batch homogeneity.
Research context: Understanding Cannabis Testing Requirements & Results in Maine (PDF)What a THC percentage actually measures
THC percentage on a certificate of analysis (COA) normally reports the mass fraction of delta‑9‑tetrahydrocannabinol (THC) or total THC (a converted sum of THC and its acidic precursor THC‑A after decarboxylation) in the tested matrix — flower, extract, or edible. In practice lab reports may show both measured THC‑A and THC, and a calculated "total THC" that estimates the THC available after heating. That’s why COAs sometimes list several cannabinoid numbers rather than one single figure. (maine.gov)
The units matter: percent by weight (wt%) is common for dried flower; milligrams per package or per serving is common for edibles and tinctures. A 20% THC flower means ~200 mg THC per gram of tested sample, while an edible labeled in milligrams gives you a dose per piece. Knowing the unit is essential to comparing items and to matching a product’s label to your intended use. (www1.maine.gov)
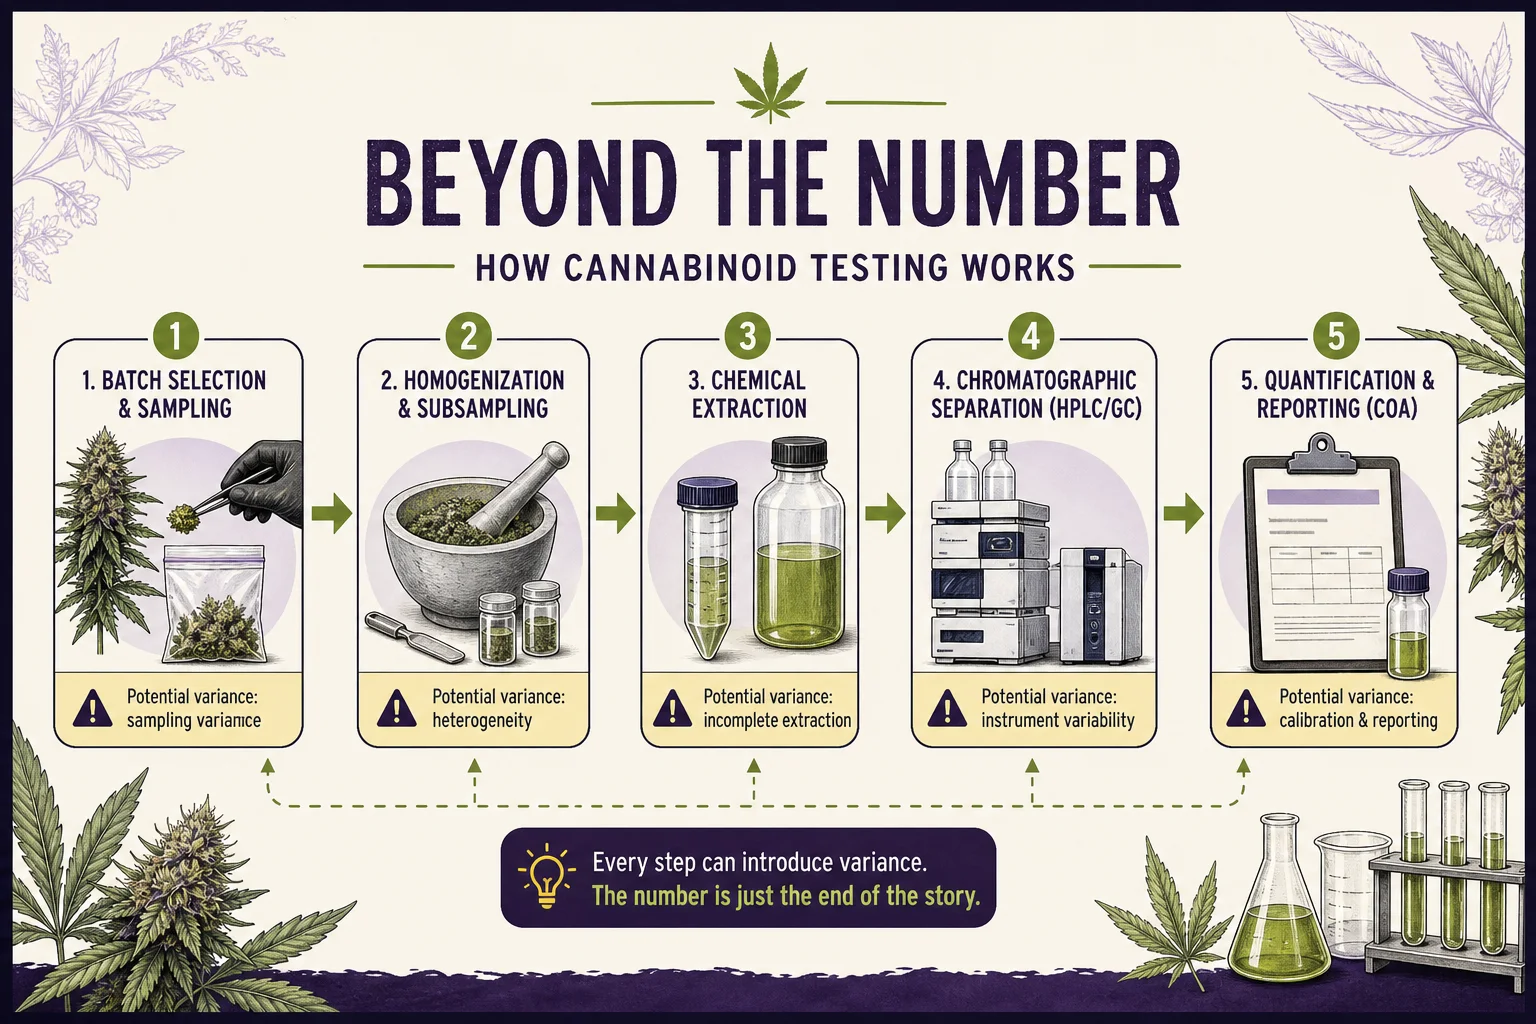
Evidence diagram of the typical laboratory workflow that leads to a potency value. Each step is labeled and briefly explained. This teaches where variability enters the number. Limit: diagram is explanatory and not a certified SOP.
Research context: Cannabis Laboratory Quality Assurance Program: Exercise 2 Cannabinoid Final ReportHow labs produce that number: sampling, extraction, and instruments
A COA is not a single moment frozen from the plant; it is the end point of a process: collect a representative sample from a batch, prepare (homogenize, weigh, extract), separate cannabinoids, detect and quantify. Different matrices and methods (GC, LC‑MS/MS, HPLC, UV) each have strengths and limitations. A lab’s sample handling and method selection affect the final reported percent. Good lab practice includes validated methods and documented sample chains of custody. (maine.gov)
Sampling is often the weakest link. If a batch of flower has hot spots (nug clusters higher in cannabinoid content) or if a topical or edible is not homogenous, a single sample can over‑ or under‑represent what a consumer actually receives. That’s why Maine’s adult‑use rules include homogeneity checks and require potency testing by matrix type (flower vs. concentrate vs. edible). (maine.gov)
Laboratories then quantify cannabinoids. Instruments read a chemical signal; calibrations convert that signal into mass. Reference materials and standards are crucial so different labs measure on the same scale. NIST and collaborative programs help improve comparability across labs by providing reference materials and inter‑lab exercises. Without shared standards, two competent labs can still report slightly different numbers for the same sample. (nist.gov)
Measurement uncertainty, standards, and why numbers vary
Every quantitative lab result carries uncertainty: a statistical interval that reflects known sources of variation — sampling, preparation, instrument precision, calibration, and analyst decisions. Measurement uncertainty is not an admission of incompetence; it’s the lab being honest about how confidently it can place the true value. Published method validation and uncertainty calculations are standard practice in regulated testing. (pubmed.ncbi.nlm.nih.gov)
Programs like NIST’s Cannabis Laboratory Quality Assurance Program (CannaQAP) exist precisely to help labs understand and reduce these uncertainties, by offering fit‑for‑purpose methods and reference materials and by running inter‑laboratory exercises that reveal common biases. Consistent reference materials and routine proficiency testing narrow differences between labs over time. Still, even with strong QA, the reported percent should be read as an estimate with an implied uncertainty band. (nist.gov)
Regulators and manufacturers sometimes set tolerance bands (for example, ±10% around a labeled potency for manufactured products) to manage acceptable variability across shelf life. That’s why a lab result of 20% and a label claiming 22% are not necessarily in conflict — but access to the COA and its date helps make sense of the comparison. The FDA has long emphasized potency validation and label accuracy in related contexts. (fda.gov)
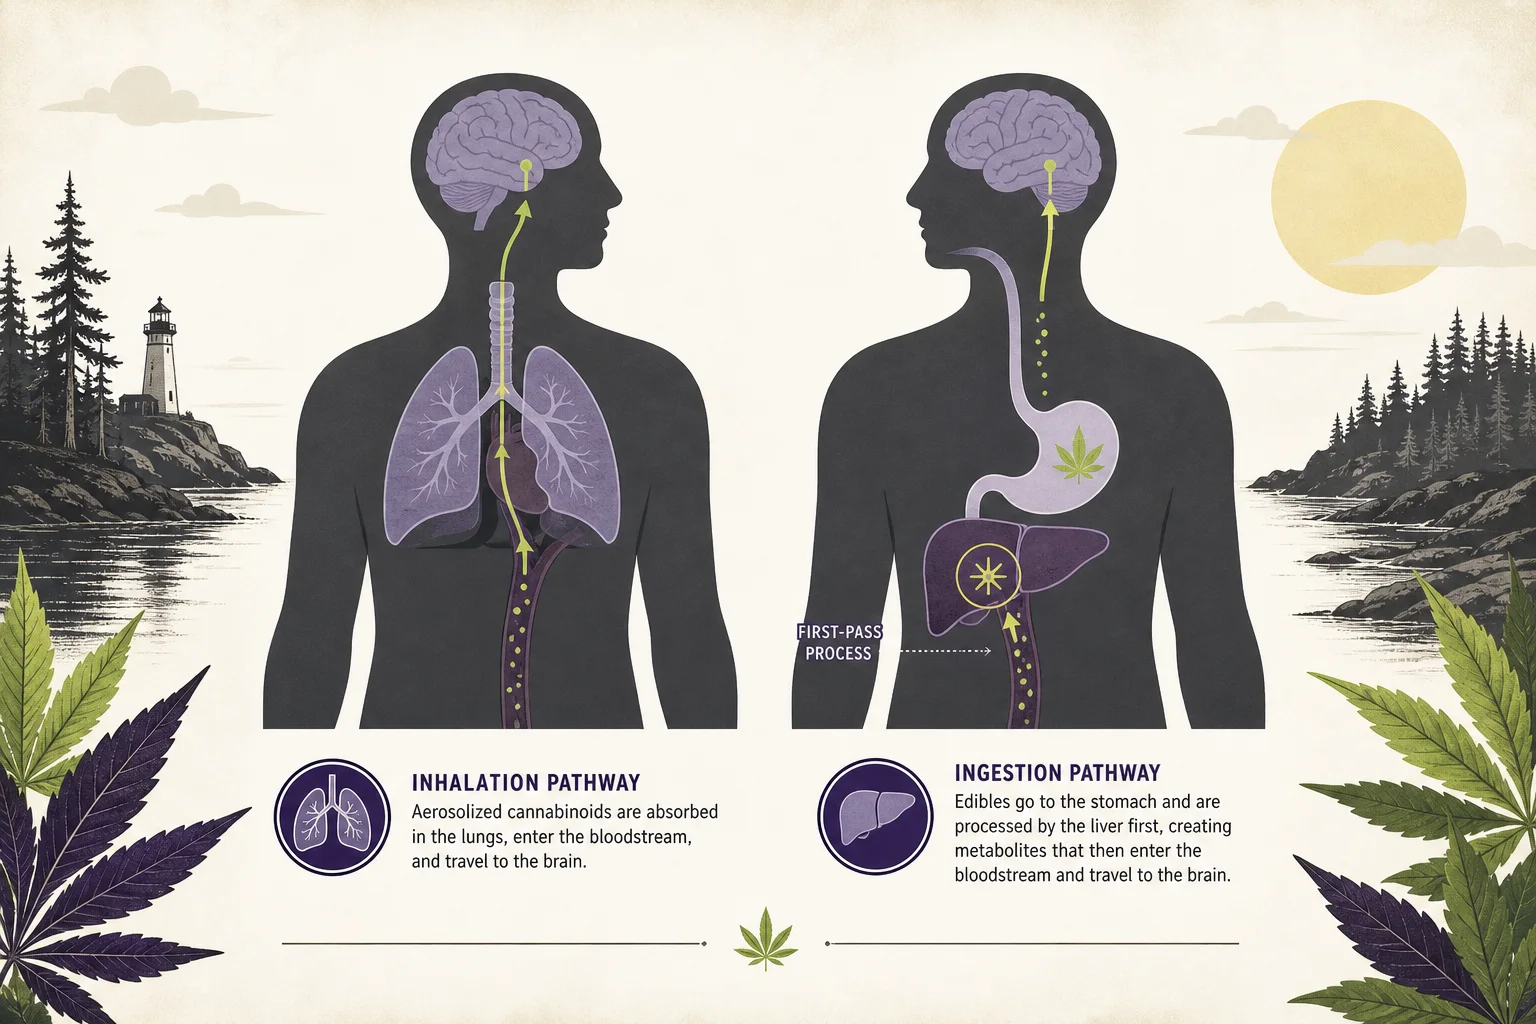
A pharmacology diagram comparing inhalation and oral routes: timing to bloodstream, first‑pass metabolism for oral routes, and the production of 11‑hydroxy‑THC. Use this to explain why the same milligrams can produce different effects. Limit: explanatory only; no dose recommendations.
Research context: Marijuana use and driving (CDC archived stacks)Route of use and pharmacology: why the same percent can feel different
Percent doesn’t equal effect. The route of administration — smoking/vaporizing, oral, sublingual, topical — changes the pharmacology dramatically. Inhalation delivers cannabinoids rapidly to the bloodstream with high bioavailability relative to many oral formats; edibles pass through first‑pass metabolism in the liver, producing different metabolites (including 11‑hydroxy‑THC) that can be more psychoactive for some people. That’s one reason the same milligram amount of THC can feel different when eaten versus inhaled. (stacks.cdc.gov)
Individual biology (age, sex, genetics), tolerance from prior exposure, co‑administered substances (alcohol, medicines), and context (food in the stomach, activity level) all affect how a given THC amount translates to subjective and objective effects. A percent number cannot capture those person‑level variables; it is a piece of product evidence, not a predictor of an individual’s response. (stacks.cdc.gov)
Because impairment and safety are policy concerns, public health agencies recommend conservative behavior (for example, avoiding driving while impaired) rather than trying to infer an impairment threshold from a percent alone. The uncertainty in translating a lab value to a person’s impairment is large. (stacks.cdc.gov)
What THC percentage can’t tell you
A single THC percentage can’t answer several practically important questions:
-
Was the product tested for contaminants (pesticides, heavy metals, microbes)? Potency testing is separate from contaminant testing; in Maine adult‑use law, potency is only one of multiple required analyte categories for saleable adult‑use items. Medical cannabis in Maine is not subject to the same mandatory contaminant testing unless a provider voluntarily tests. A COA or lab name provides that information if available. (maine.gov)
-
Is the product homogenous? A potency percent won’t reveal uneven mixing in edibles or hot spots in flower. Homogeneity testing and batch‑level sampling records are the evidence you’d need. (maine.gov)
-
How fresh is the sample and how was it stored? Terpenes and some cannabinoids degrade with light, heat, and oxygen. A COA dated months before you buy doesn’t prove the product on the shelf remains identical. Packaging, storage conditions, and manufacture date matter. (maine.gov)
-
What about minor cannabinoids and terpenes that shape subjective effects? Percent only describes THC (and maybe CBD) numbers; it doesn’t show the terpene profile or the presence of CBG, CBN, or others that may modulate aroma and experience. These chemical players are separate tests and carry their own measurement and interpretation challenges. (nist.gov)
-
Does the COA represent the whole batch? Sampling plans, traceability records, and batch IDs are needed to trust that a COA maps to the item you’re buying. Maine’s rules require certain traceability and documentation so COAs should be traceable to batches in the adult‑use program. (maine.gov)
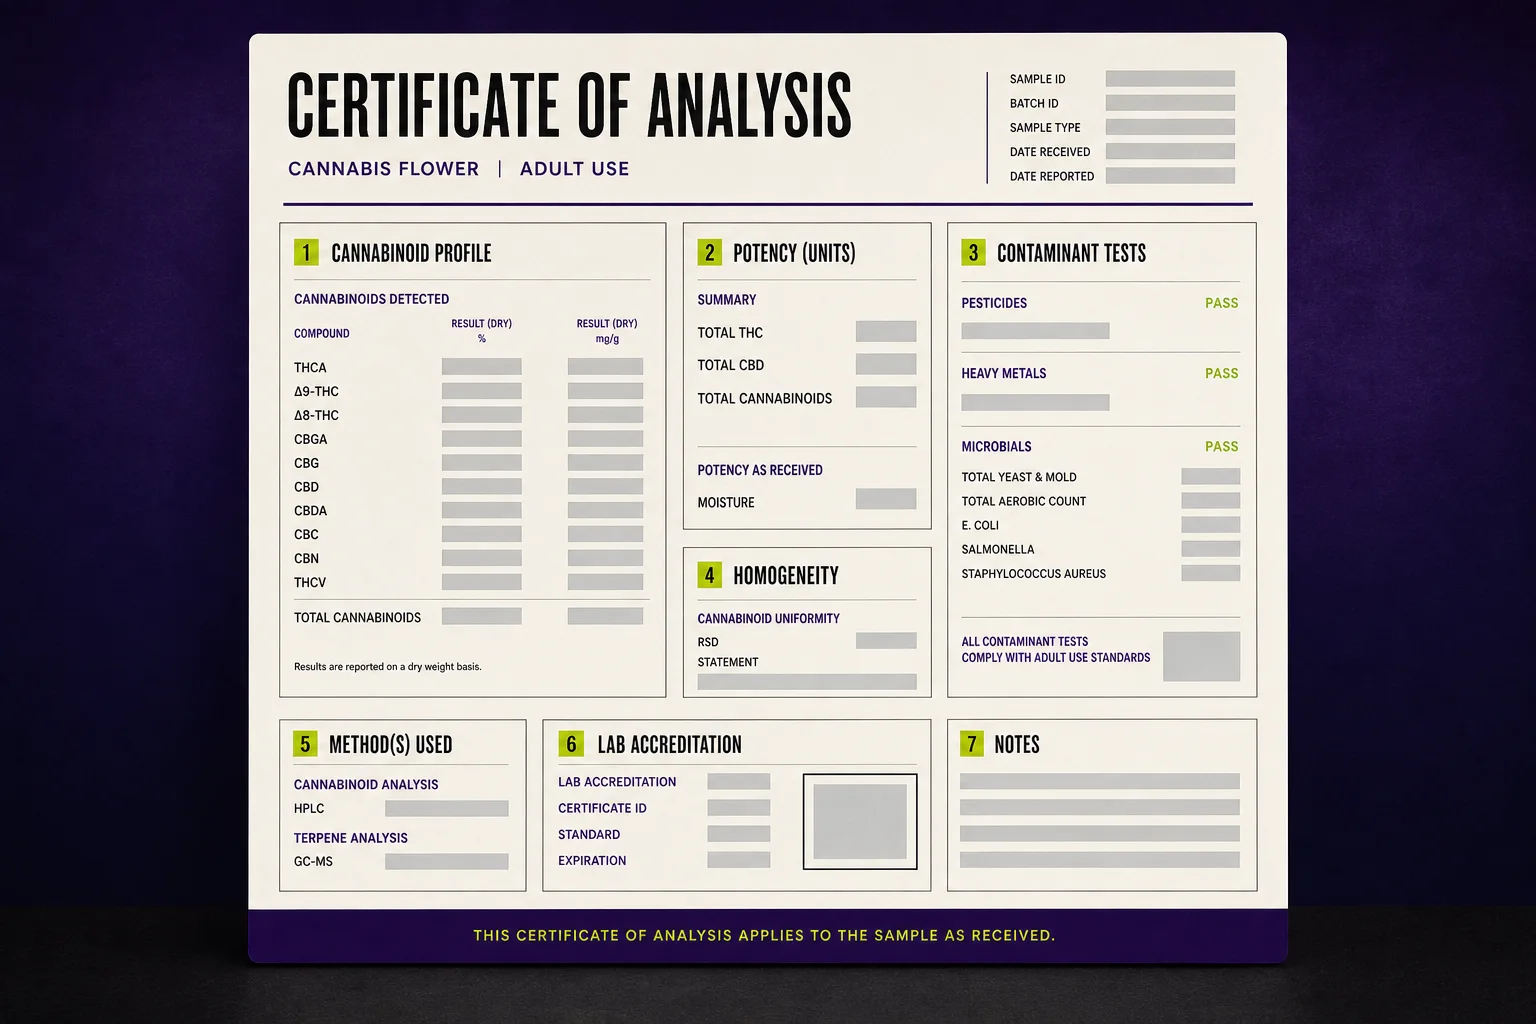
Practical questions to review before you buy or use
If potency is part of a purchase or decision, practical, traceable questions to review include: Which lab performed the test? What was the sample date and batch ID? Does the COA show contaminants, homogeneity, and terpenes as well as cannabinoids? What method was used (HPLC, GC, MS)? Is there an uncertainty statement or certificate trace? A clear, recent COA from a certified testing facility gives far more context than a percent on a label alone. (maine.gov)
For medical patients or adults with safety concerns, a conversation with a clinician (or an experienced pharmacist in jurisdictions where available) that includes product evidence — COA, batch trace, route of use, and personal medical context — may be more informative than relying on percent alone. This is about building evidence, not selling a single number as an answer. (maine.gov)
Putting the number in context: a grower’s checklist and closing thoughts
From a grower’s perspective, THC percentage is a helpful benchmark — it guides breeding choices, harvest timing, and product description. But responsible growers also document sampling, drying/curing conditions, and provide accessible COAs that show the full panel of required tests. Maine’s adult‑use rules and guidance documents encourage this broader evidence approach so consumers can make informed choices beyond a single potency claim. (maine.gov)
Think of THC percentage as a laboratory note about one chemical dimension of a product sample. It’s valuable, but it’s never a quality score on its own. Consider it a lab instrument reading: combine it with COA details, sampling and batch records, product age and storage, route of use, and the rest of the chemistry before forming an expectation about how a product may behave for you.
Key takeaways
- THC percentage reports cannabinoid concentration for a tested sample; units (wt%, mg/serving) matter. (maine.gov)
- A COA is the product of sampling, preparation, instrument method, and calibration; sampling is often the largest source of variation. (maine.gov)
- Every potency result carries measurement uncertainty; inter‑lab programs and reference materials reduce but do not eliminate differences. (pubmed.ncbi.nlm.nih.gov)
- The same THC amount can produce different effects depending on route of use, biology, and context — percent alone can’t predict impairment or subjective experience. (stacks.cdc.gov)
- Seek the COA, sampling and batch info, and check for contaminant and homogeneity tests in addition to potency. (maine.gov)
FAQs
Q: Does Maine require potency testing for all cannabis products? A: Maine’s adult‑use program requires potency testing as part of its mandatory testing categories; potency plus homogeneity and cannabinoid profile are required for adult‑use items. Medical cannabis is not subject to the same mandatory contaminant testing unless voluntarily tested. (maine.gov)
Q: Why do two labs report different THC percentages for the same product? A: Differences can come from sampling, method (instrument and extraction), calibration standards, analyst technique, and how total THC is calculated. Inter‑lab QA programs and reference materials reduce variability but do not eliminate it. (nist.gov)
Q: If a product says 20% THC, is that the amount I’ll feel when I smoke it? A: Not necessarily. Percent tells you concentration in the tested sample; route of administration, inhalation behavior, tolerance, and biotransformation (especially for edibles) determine subjective effect. (stacks.cdc.gov)
Q: What should I look for on a COA besides THC percent? A: Relevant entries on a COA include batch ID and sample date, contaminant screens (pesticides, metals, microbes), homogeneity tests for multi‑unit products, cannabinoid profile, terpene data (if available), method used, and a statement of measurement uncertainty or lab accreditation. (maine.gov)
Q: Are label tolerances like ±10% common or regulated? A: Tolerances vary by product type and jurisdiction. Some regulatory guidance and industry practice use tolerance bands (for example ±10%) for manufactured products; label accuracy expectations are part of broader quality and regulatory guidance. (fda.gov)
Questions this guide answers
Does Maine require potency testing for all cannabis products?
Maine’s adult‑use program does require potency testing as part of mandatory testing categories for items sold to adult consumers. Medical cannabis is not subject to the same mandatory contaminant testing unless voluntarily tested by providers. ([maine.gov](https://www.maine.gov/dafs/ocp/open-data/adult-use/testing-data))
Why might two labs report different THC percentages for the same sample?
Differences can come from sampling plans, extraction and instrument methods, calibration standards, analyst technique, and how total THC is calculated. Inter‑lab QA and reference materials reduce differences but do not remove them entirely. ([nist.gov](https://www.nist.gov/programs-projects/nist-tools-cannabis-laboratory-quality-assurance))
If a product says 20% THC, will that be the same effect for everyone?
No. Route of administration, prior tolerance, individual biology, co‑consumed substances, and context change how a given THC amount affects a person. Percent is product evidence, not an individualized prediction. ([stacks.cdc.gov](https://stacks.cdc.gov/cbrowse?facetRange=56&maxResults=100&parentId=cdc%3A102&pid=cdc%3A102&start=7500&t=journal+article&type=1))
What should I check on a COA besides THC percent?
Check batch ID and sample date, contaminant screens (pesticides, metals, microbes), homogeneity, cannabinoid profile and terpenes, method used, and lab accreditation or uncertainty statements. These give context the percent alone cannot. ([maine.gov](https://www.maine.gov/dafs/ocp/sites/maine.gov.dafs.ocp/files/2023-10/Understanding%20Maine%20Cannabis%20Testing%20Requirements%20%26%20Results.pdf))
Educational information only. Cannabis affects people differently and this is not medical advice.