
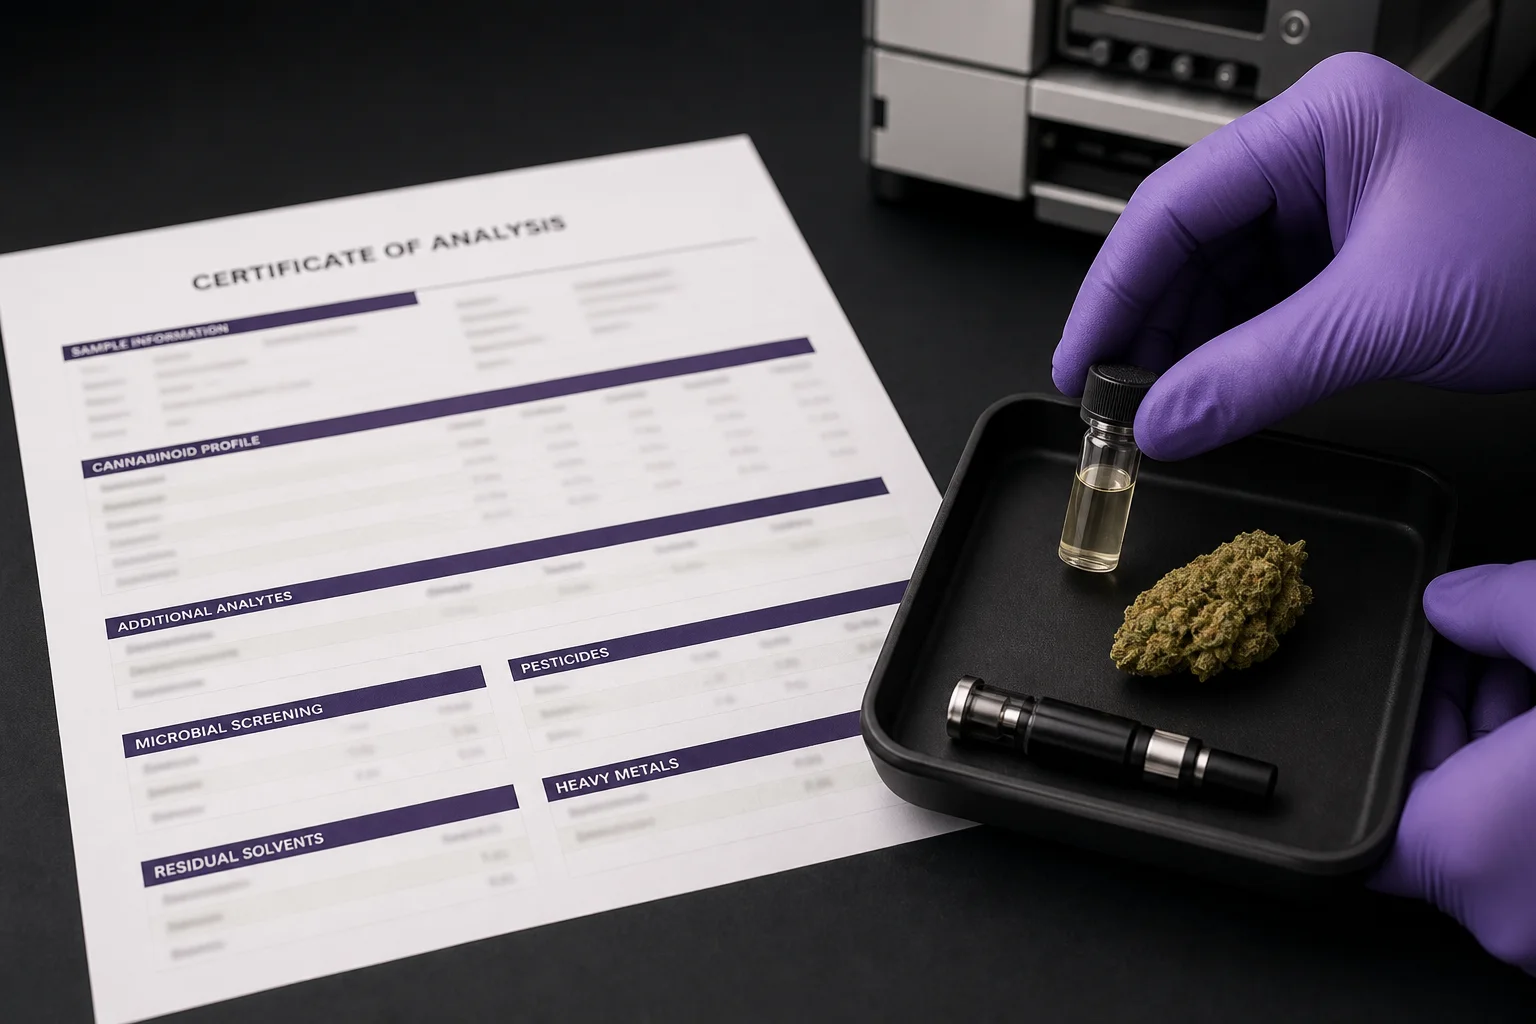
Documentary-style photo pairing a blurred Certificate of Analysis with the physical sample that was tested. This visual teaches the link between lab reports and real plant material while protecting private numerical detail. Limit: do not infer consumer effects from the pictured COA; the image shows a single lab/sample snapshot rather than a programwide trend. Source: Maine OCP adult-use testing data and NIST laboratory guidance.
Why a single percent is so tempting—and why that’s a problem
Potency as a percent of THC is easy to report, easy to understand at a glance, and convenient for shelf labels. It’s also the single most advertised number in retail packaging: consumers see 20%, 30%, or higher and assume it’s the whole story. That simplicity creates a false sense of precision. A percent number is a laboratory result, not a full description of chemistry, safety, or effect.
The lab result is useful — it measures how much of a specific molecule (or molecules) was detected in the sample that was analyzed. But potency measurements are built on many steps that introduce variation: where and how the sample was taken from the harvest, how the plant material was prepared, which chemical forms were measured, and which analytical method the lab used. Those steps matter when you try to compare a COA (Certificate of Analysis) from one batch and lab with another. See Maine’s public adult-use testing data for how the Office of Cannabis Policy collects mandatory potency results. (maine.gov)
Because a percent can hide uncertainty, it’s worth shifting from “What is the perfect THC number?” to “What does this THC number mean in context?” — and what it doesn’t mean.
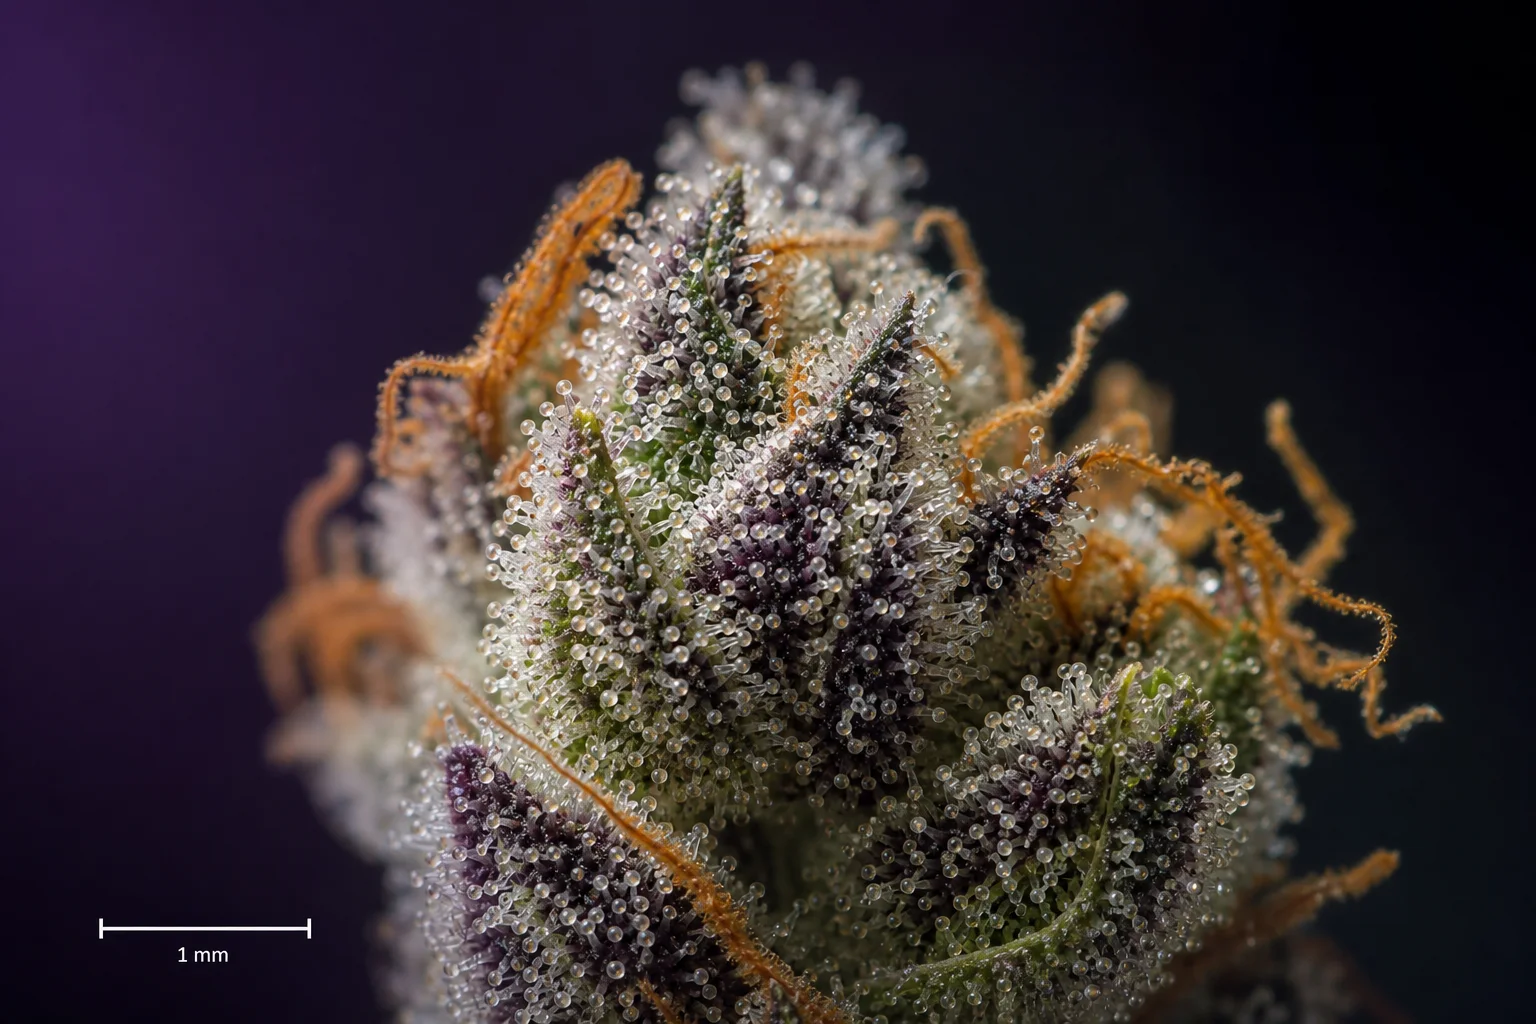
A botanically accurate macro of trichomes (glandular hairs) with a scale bar. This teaches that cannabinoids are produced in specific plant structures and that chemistry can vary within and between buds. Limit: this image does not quantify THC and is not a COA substitute.
Research context: Pitfalls in the analysis of phytocannabinoids in cannabis inflorescence - PubMedWhat “THC percentage” actually measures
When a lab reports “THC %” it is reporting concentration: mass of THC per mass of sample, usually expressed as a percentage by weight. Labs typically convert detected quantities to a percent of the tested material (for dried flower, usually percent by dry weight), and that value is what ends up on many labels.
There are important technical distinctions underneath that label. Plants contain THCA (the acid form) which converts to Δ9‑THC when heated (decarboxylation). Some labs report “total THC” — a calculated sum that includes measured Δ9‑THC plus the decarboxylated equivalent of THCA — while others report only what the instrument directly measured. That choice affects the number on a COA. Analytical methods and whether the lab reports total or free THC are discussed in public standards and reviews of cannabinoid analysis. (pubmed.ncbi.nlm.nih.gov)
Units and moisture matter too. The same bud measured at 12% moisture will give a different percentage than if measured fully dried. Good COAs specify the basis (dry weight, wet weight, or per-package dose) so a label reader can interpret the number responsibly.
How laboratories produce that number — and where uncertainty creeps in
Producing a potency number involves sampling, sample preparation, instrument analysis, and data reduction. Each step adds potential variability. First: sampling. A single plant, a handful of buds, or a homogenized composite sample can give different results because THC is not distributed perfectly evenly across a harvest. Labs and regulatory programs set sampling rules to reduce this variability, but sampling error still exists. Maine’s testing program requires licensed testing facilities to report potency results and other mandatory analytes, and those results are compiled centrally. The data reflect initial, mandatory testing of retail batches, not every internal lab or research test. (maine.gov)
Second: preparation and method. Extraction solvents, time, temperatures, and whether the lab measures only free Δ9‑THC or both THCA and Δ9‑THC affect quantitation. Chromatographic techniques (HPLC, GC, or newer spectroscopic approaches) and detector types each have strengths and limitations. Recent technical reviews describe pitfalls (unstable cannabinoids, isomers, matrix effects) and ongoing improvements in method validation. Laboratory competence — validated methods, reference materials, and quality assurance programs — is crucial for reliable numbers. NIST’s work on cannabis reference materials and CannaQAP aims to improve comparability across laboratories. (nist.gov)
Third: measurement uncertainty and reporting. No laboratory measurement is exact. Well-run labs provide method performance characteristics (limits of detection, limits of quantitation, repeatability) and a COA will sometimes include a range or a standard uncertainty. Not all COAs show the same level of detail. If a COA omits uncertainty, consider that the printed percent is still an estimate with a laboratory-specific confidence interval behind it. PubMed reviews of analytical variability emphasize the need for validated methods and routine quality controls to reduce such uncertainty. (pubmed.ncbi.nlm.nih.gov)
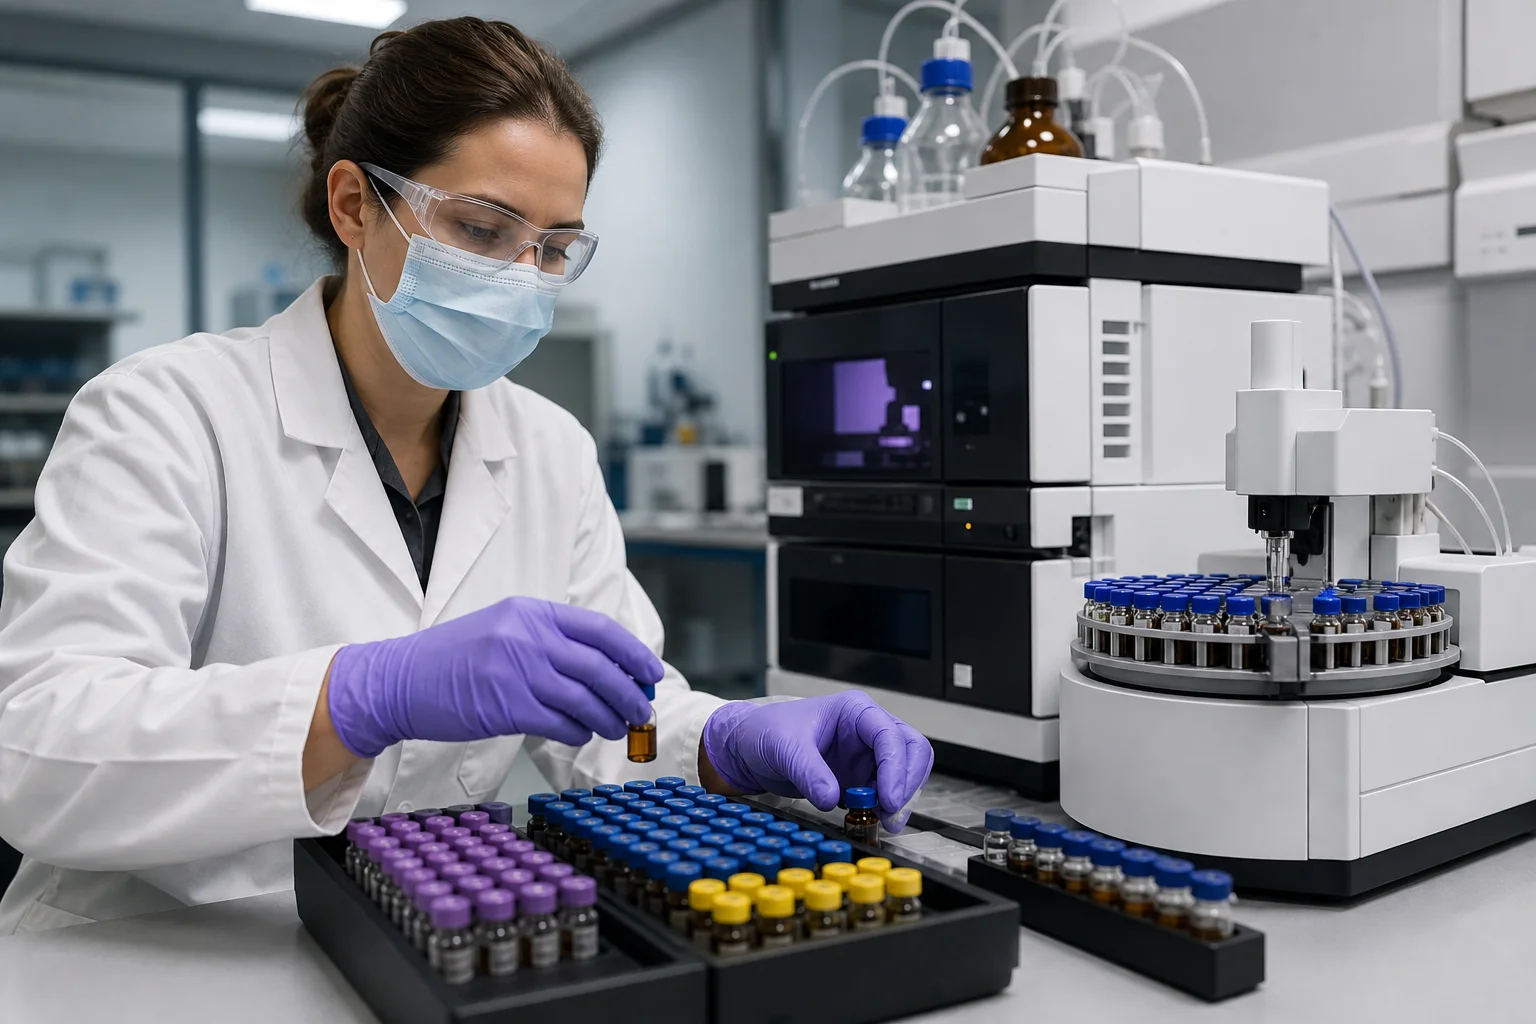
An action photo in an analytical lab showing sample preparation and vials queued for HPLC analysis. This teaches the extraction and instrument step where THC is quantified. Limit: the image is illustrative; instrument presence does not certify method validation or accreditation.
What a number can’t tell you about effect or experience
A percent of THC on dried flower says nothing direct about how any given person will feel. Effects depend on route of administration (smoked/vaped inhalation, oral ingestion, sublingual), dose consumed, individual sensitivity, tolerance, and prior exposure. Bioavailability differs by route — inhalation gives fast, partial absorption but faster offset; oral ingestion leads to slower onset, variable absorption, and metabolic conversion (including active metabolites) that change subjective experience.
Put plainly: eating a gram of flower and smoking a gram are not equivalent even if the THC % is the same. Concentrates and edibles change both the amount available to the body and the way THC is metabolized. The Centers for Disease Control and Prevention summarize that highly concentrated THC products are associated with higher rates of adverse outcomes and that route and formulation affect risk profiles. The CDC’s public materials also stress that lab labels alone do not predict individual effects. (cdc.gov)
That gap is why clinical and public health guidance talks about patterns of use and product type rather than a single potency figure. If you’re trying to predict onset, peak, or duration, percent-THC is only one piece of a multi-variable puzzle.
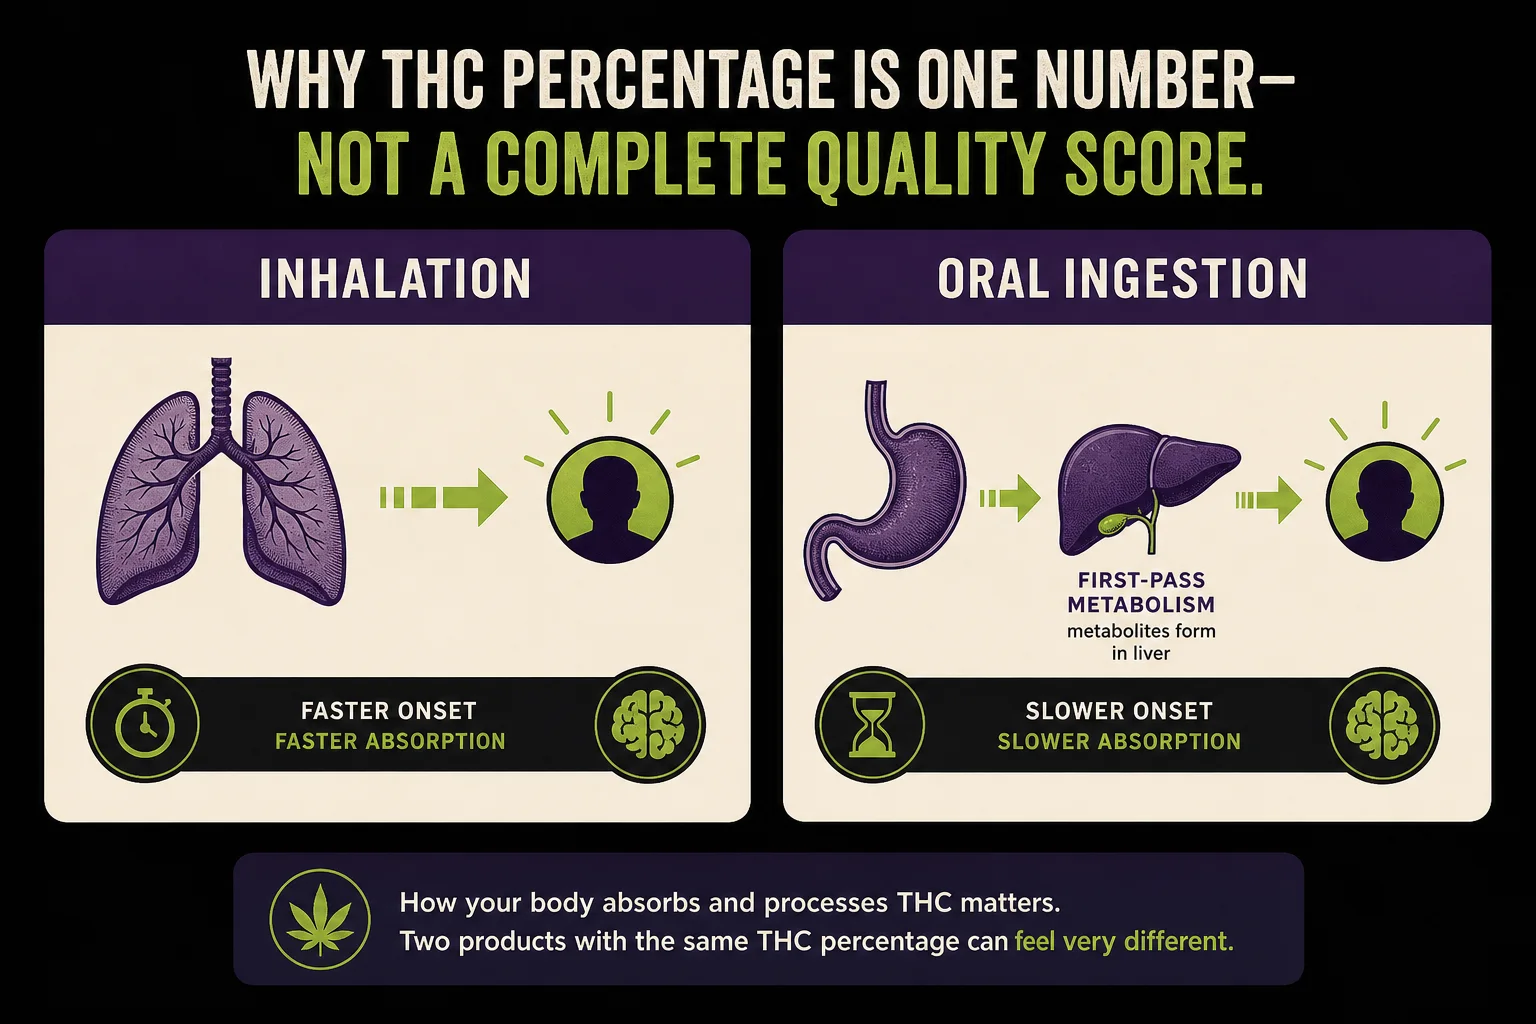
A clear explanatory diagram comparing inhalation and oral routes: timing of onset, bioavailability differences, and metabolic conversion (non-numeric). This visual teaches why identical percent-THC can lead to different experiences depending on route. Limit: avoid numeric bioavailability claims; diagram should be qualitative.
Research context: Cannabis Health EffectsWhat the percent leaves out: chemistry, homogeneity, and safety signals
THC percentage ignores the broader chemical fingerprint of a sample. Cannabinoids beyond THC (CBD, CBG, CBC, minor cannabinoids) and non-cannabinoid compounds (terpenes, flavonoids) are part of the plant’s chemistry. Those compounds may affect aroma, flavor, and subjective perception — they also matter for some research questions — and COAs that include cannabinoid profiles and terpene panels give a more complete picture than THC alone. Analytical reviews and method papers discuss why multi-analyte testing is recommended. (pubmed.ncbi.nlm.nih.gov)
Homogeneity matters for safety and labeling. A bag or cartridge must be uniform enough so that different portions don’t differ wildly in THC content. Maine’s mandatory testing includes potency homogeneity checks in certain product types to ensure accurate labeling and dose consistency. A single high-THC outlier in a batch can change average numbers but also indicate a mixing or sampling problem that a single percent on a small sample won’t reveal. Maine’s adult-use testing dashboard and reporting process are intended to capture those mandatory checks across licensed products. (maine.gov)
Finally, the percent says nothing about contaminants: pesticides, heavy metals, residual solvents, or microbial growth are separate analyte categories in regulatory testing. A high-THC result on contaminated material is still a high-THC result; it does not mean the product was safe or compliant. Regulatory data and routine COAs separate potency from safety analytes for this reason. (maine.gov)
Maine’s rules, public data, and how adult-use differs from medical context
In Maine’s adult-use program, certain analyte categories — potency among them — are mandatory for initial testing and must be reported to the Office of Cannabis Policy (OCP); the OCP posts aggregate adult-use testing data and Certificates of Analysis results in open-data formats. Those data are valuable for program oversight and for consumers who want transparency about batch tests. Note: the OCP’s adult-use data reflect the adult-use program and initial mandatory testing; medical program rules and reporting can follow other processes and may not appear in the same public datasets. Always check which program the COA refers to. (maine.gov)
The state’s testing rules are designed to protect public health by enforcing analyte categories and failure thresholds (for contaminants, for instance) while requiring potency reporting to support truthful labeling. But state-level rules don’t eliminate lab-to-lab differences. That’s why federal and standards organizations (NIST among them) are working to provide reference materials and inter-lab proficiency testing to improve comparability. These national efforts complement Maine’s local oversight and make COA comparison more meaningful over time. (nist.gov)
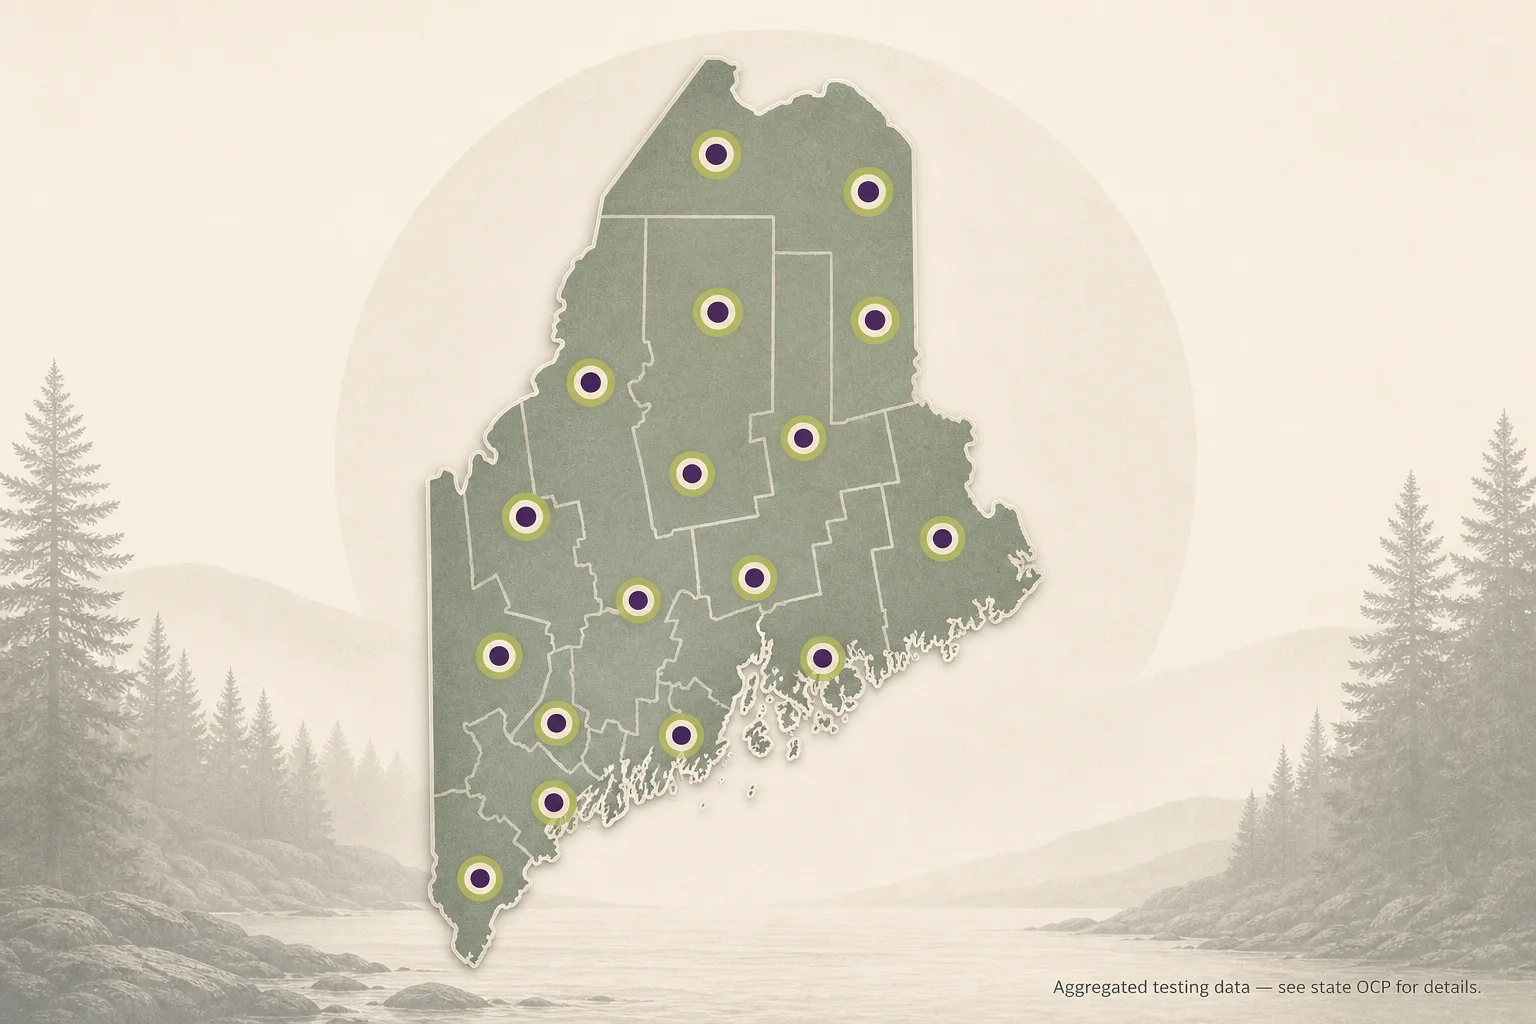
Stylized map of Maine showing distribution of adult-use testing submissions (generalized markers, no readable counts). This teaches that testing is a statewide system and that OCP aggregates mandatory results; it is an overview image rather than a data dashboard. Limit: do not display specific counts or microdata in the image.
Research context: Adult Use Testing DataPractical questions to ask about any potency number
When you look at a label or COA, ask these practical questions:
-
Is the COA from an accredited, independent lab and does it show the method used (HPLC, GC, etc.)? Labs that document method validation and accreditation generally provide more trustworthy results. NIST’s CannaQAP and reference materials exist to make these comparisons more reliable. (nist.gov)
-
Does the COA specify “total THC” and the basis (dry weight vs per-package dose)? If not, the number could be measuring only free Δ9‑THC or a calculated total that includes THCA.
-
Is there sample homogeneity data or replicate testing? Homogeneity panels and replicate measures reduce the chance that the reported percent is an unrepresentative outlier. Maine’s testing program requires reporting of certain homogeneity checks for some products. (maine.gov)
-
Are other analytes reported (major cannabinoids, terpenes, contaminants) so you can see the chemical fingerprint and safety picture? A complete COA will separate potency from contaminants and list method performance metrics. PubMed reviews highlight how a multi-analyte approach improves reliability. (pubmed.ncbi.nlm.nih.gov)
If a COA is missing key details, ask your retailer, producer, or lab for clarification before relying on the percent alone.
Reading potency labels responsibly — a practical bottom line
THC percentage is a useful laboratory measurement and an important regulatory requirement, but it is not a quality stamp or a personalized prediction of effect. Think of percent-THC as a lab snapshot: an estimate tied to a specific sample, produced by a specific method, and constrained by sampling and analytical uncertainty. Good COAs and transparent reporting reduce that uncertainty and let consumers and patients make better-informed choices.
Maine’s public adult-use testing data and national standards work (NIST and peer-reviewed method reviews) are helping the community move from isolated numbers toward comparable, reproducible data. For gardeners and small-batch producers, that means: document your sampling; keep clear records; work with accredited labs; and communicate COA details so the percent becomes a meaningful metric rather than a marketing bullet.
Educational information only. Cannabis affects people differently and this is not medical advice.
Questions this guide answers
Is a higher THC percent always "stronger"?
Higher percent-THC indicates more THC by weight in the tested sample, but it does not predict how an individual will experience the product because route, dose, metabolism, and other cannabinoids and terpenes also influence effects. See CDC materials for population-level risk notes. ([cdc.gov](https://www.cdc.gov/cannabis/health-effects/))
What’s the difference between "THC" and "total THC" on a COA?
"THC" may refer to measured Δ9‑THC only; "total THC" usually adds the decarboxylation-equivalent of THCA to estimate potential Δ9‑THC after heating. Confirm which basis a COA uses because the choice changes the reported percent. ([pubmed.ncbi.nlm.nih.gov](https://pubmed.ncbi.nlm.nih.gov/32285185/))
Can labs report different THC percents for the same batch?
Yes. Differences in sampling, sample prep, extraction, and analytical method — plus laboratory competence and whether results are reported as total versus free THC — can produce different numbers. NIST’s quality assurance efforts aim to reduce such variability. ([nist.gov](https://www.nist.gov/programs-projects/nist-tools-cannabis-laboratory-quality-assurance))
Should I trust a COA posted by a producer or the one from the testing lab?
Trust evidence where it’s transparent: a COA from an accredited independent lab that lists methods, analytes, and measurement notes is the strongest. If the producer posts the COA, check the issuing lab’s accreditation and whether the COA is complete. Maine’s OCP posting of mandatory testing supports verification of adult-use COAs. ([maine.gov](https://www.maine.gov/dafs/ocp/open-data/adult-use/testing-data))
Do potency labels include measurement uncertainty?
Not always. Best-practice COAs include method performance metrics and uncertainty ranges, but some consumer-facing labels only print a rounded percent. If uncertainty isn’t shown, request the full COA. Method reviews recommend validated methods and routine QC to characterize uncertainty. ([pubmed.ncbi.nlm.nih.gov](https://pubmed.ncbi.nlm.nih.gov/40573182/))
Educational information only. Cannabis affects people differently and this is not medical advice.