
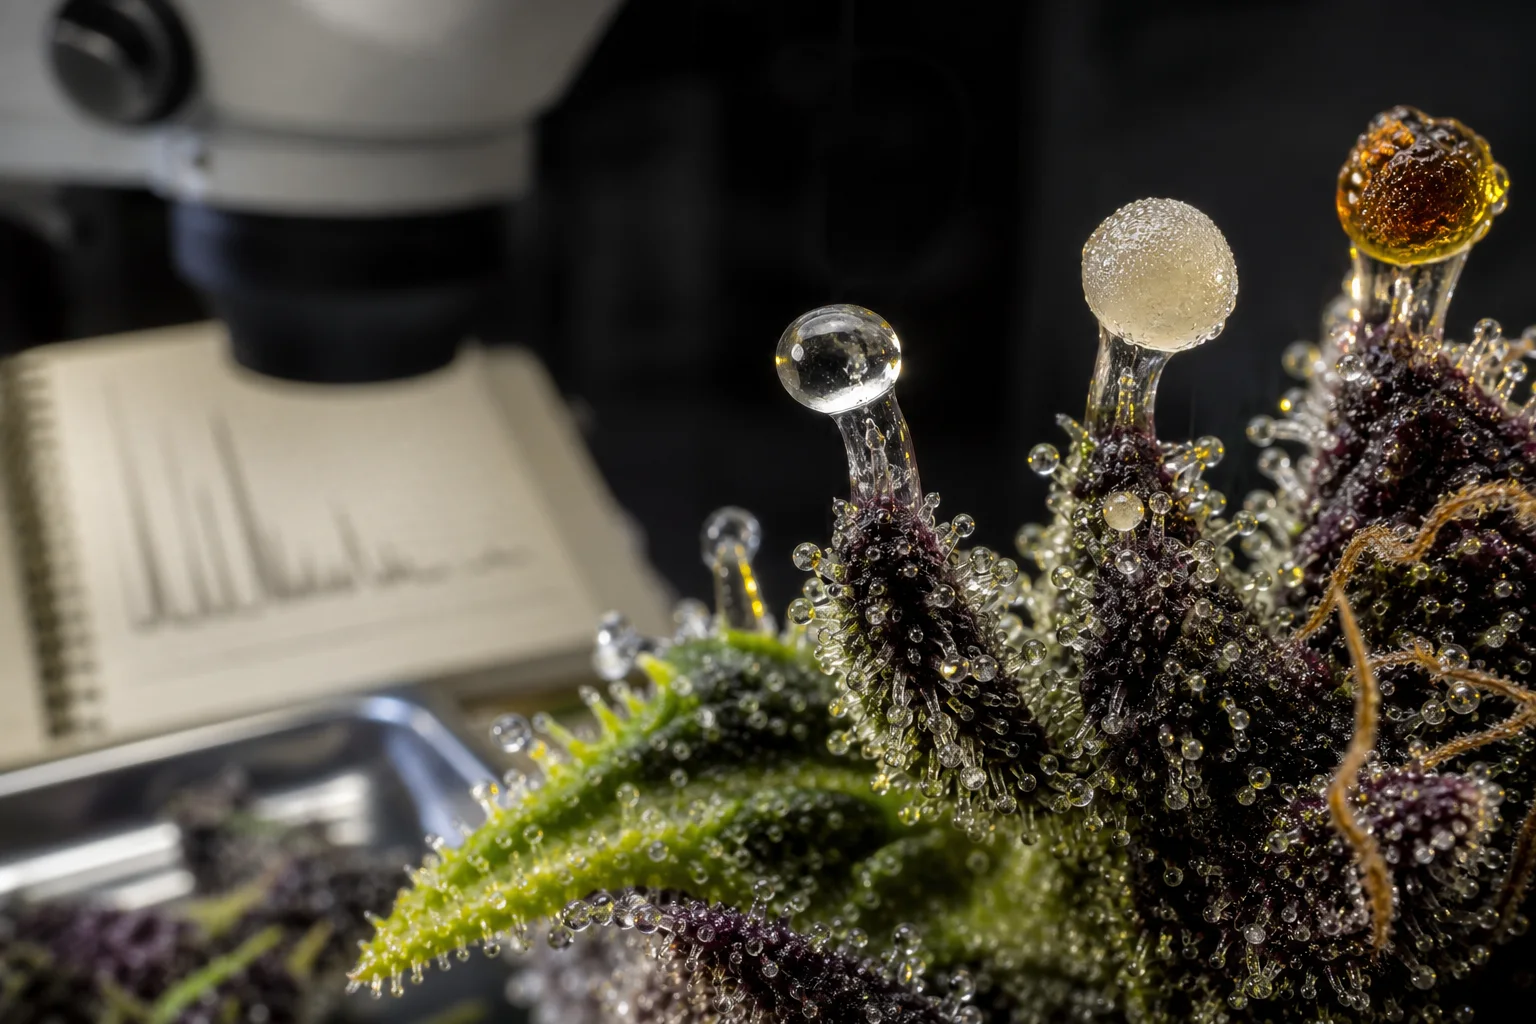
Glandular trichomes at different optical stages (clear → milky → amber). Color is an emergent property of structure, chemistry, and handling — useful but not definitive for harvest timing.
Mainezilla original editorial visual · AI-assisted art directionWhy trichomes matter: anatomy, chemistry, and the harvest question
Glandular trichomes are the microscopic chemical factories that produce the cannabinoids, terpenes, and flavonoids that make cannabis flowers commercially and biologically interesting. In female cannabis flowers the dominant secretory structures are capitate-stalked glandular trichomes: a multicellular stalk, a secretory disk, and a subcuticular cavity that holds a lipid-rich resin. This resin is where acidic cannabinoids (for example THCA and CBDA) accumulate before any heat-induced decarboxylation occurs. ([pubmed.ncbi.nlm.nih.gov](https://pubmed.ncbi.nlm.nih.gov/34616415/))
For growers the practical question is simple-sounding but compound in practice: when do you stop flowering and harvest? Grower goals differ — total THCA, CBD:THC ratio, terpene content, visual aesthetics, or shelf stability — and different objectives are governed by different biochemistry and kinetics. Expecting trichome color alone to answer all those goals is a category error: color is one visible signal that must be integrated with chemistry and context. ([pubmed.ncbi.nlm.nih.gov](https://pubmed.ncbi.nlm.nih.gov/39806251/))
This article explains the biological reasons trichomes change appearance, reviews the evidence linking that appearance to chemical state, and lays out practical sampling and interpretation strategies so you can read claims and lab records intelligently — without making consumption recommendations.
What makes a trichome look 'clear,' 'milky,' or 'amber'?
The commonly used visual stages (clear → cloudy/milky → amber) are shorthand for several overlapping physical and chemical processes inside the trichome head. Early in development the subcuticular cavity contains a relatively transparent mix of lipophilic resin and smaller concentrations of acidic cannabinoids; light passes through and the head appears clear. As secretory disk cells keep producing resin and secondary metabolites the cavity fills with droplets and microcrystals that scatter light, producing the cloudy or milky look. Over time and with oxidative chemistry and pigment changes, the resin can darken toward amber or brown. These observations are synthesized in recent reviews of glandular trichome anatomy and maturation. ([pubmed.ncbi.nlm.nih.gov](https://pubmed.ncbi.nlm.nih.gov/34616415/))
Importantly, 'amber' is not a chemically unitary state. Color change can come from (a) concentration and recrystallization of acidic cannabinoids, (b) oxidation and polymerization of terpenes and other phenolics, (c) accumulation of pigmented secondary metabolites or breakdown products, and (d) deposition of cellular debris or browning of surrounding calyx tissue. That means two trichomes that look equally amber may contain different proportions of cannabinoids and terpenes, or different oxidation products. ([pubmed.ncbi.nlm.nih.gov](https://pubmed.ncbi.nlm.nih.gov/34616415/))
Optical factors amplify the problem: incident lighting, microscope microscope objective, camera white balance, and even the angle of observation change perceived color. What a naked eye sees on a sunlit plant can diverge from a stereomicroscope image or a camera photo under LED lights, so consistent viewing conditions are essential if you use color as a repeated signal.
From cells to chemistry: how development maps to cannabinoid and terpene accumulation
Molecular and microscopy studies show cannabinoid biosynthesis is spatially localized: synthetic enzymes in the disk cells supply acidic cannabinoids (e.g., THCA, CBDA) that accumulate inside the subcuticular cavity, while terpenoid biosynthesis follows overlapping but distinct metabolic routes. Because cannabinoids are synthesized as acids and stored in a lipid environment, the timing of production, storage, and subsequent post-harvest transformation matters for measured chemistry. Laser microdissection and targeted LC–MS have directly measured cannabinoids in isolated trichomes, confirming trichome heads are the dominant storage site. ([pubmed.ncbi.nlm.nih.gov](https://pubmed.ncbi.nlm.nih.gov/23280038/?dopt=Abstract))
Time-course metabolomic and proteomic work shows that trichome development and metabolic enzyme abundance change over the flowering window. Proteins involved in cannabinoid biosynthesis and lipid metabolism rise as secretory cells mature, paralleling increases in absolute cannabinoid levels in many cultivars. However, absolute potency and the timing of the peak differ by cultivar and environmental history; modern bred cultivars often have larger, more metabolically active trichomes than older landraces. ([pubmed.ncbi.nlm.nih.gov](https://pubmed.ncbi.nlm.nih.gov/39806251/))
Terpenes are volatile and chemically labile: their absolute and relative abundances are sensitive to cultivar genetics and to environmental factors like temperature, humidity, light spectrum, and stress. That is why a harvest timed to maximize acidic cannabinoids may miss the point if the grower’s priority is preserving a delicate monoterpene profile; those compounds can be lost or chemically altered faster than cannabinoids accumulate. ([pubmed.ncbi.nlm.nih.gov](https://pubmed.ncbi.nlm.nih.gov/33526109/))
Sampling bias: why where and how you look changes the story
Two related errors commonly trip up growers and lab-readers: (1) treating a few trichomes as representative of the whole plant, and (2) conflating visual bias with chemical averaging. Trichome maturity is heterogeneous across a single cola: sugar leaves, calyx bracts, and the apical buds can mature at different rates and show different proportions of clear, milky, or amber heads. Single-trichome analyses reveal important heterogeneity at the microscopic scale; some trichomes on the same flower can differ markedly in phytocannabinoid content. That heterogeneity makes careful sampling protocols essential if lab results are to reflect the lot you intend to sell or evaluate. ([pubmed.ncbi.nlm.nih.gov](https://pubmed.ncbi.nlm.nih.gov/40139041/))
Observation method introduces its own bias. For example, photographing flowers under a high-CRI LED will emphasize some color channels; a stereomicroscope under diffuse LED light produces a different appearance; and transmitted light microscopy or CARS imaging produces chemically specific contrasts that naked-eye color cannot replicate. Samples collected for lab analysis (composite flower samples, whole-bud homogenates, or isolated trichomes) will give different numerical answers for cannabinoids and terpenes. Make sampling explicit: record which tissues were sampled, what magnification and light source were used for visual scoring, and whether the lab reports total potential (acid + decarboxylated cannabinoids) or only measured totals. ([pubmed.ncbi.nlm.nih.gov](https://pubmed.ncbi.nlm.nih.gov/30419820/))
Finally, lab turnarounds and post-harvest handling (drying temperature, trimming, cure) can transform the same harvest into very different chemical profiles. For terpenes especially, the path between harvest and assay is a chemical gauntlet; that’s why preservation studies emphasize handling protocols as much as harvest timing. ([pubmed.ncbi.nlm.nih.gov](https://pubmed.ncbi.nlm.nih.gov/33526109/))
- Heterogeneity across plant parts means a single bud photo can misrepresent a batch.
- Observation equipment and lighting change perceived color.
- Lab sample type and handling strongly influence measured cannabinoids and terpenes.
Cultivar and environment: why genetics and history matter more than a color chart
Genetics set the baseline. Modern cultivars selected for high THCA frequently have larger, more productive trichomes with more secretory disk cells and higher metabolic flux through cannabinoid pathways; landraces often show different timing and absolute yields. Those inherited morphologies change both the time course of accumulation and the optical endpoint of maturation. So two plants scored identically on a color chart may have very different cannabinoid or terpene profiles simply because their genetics governed production and storage capacity from the start. ([pubmed.ncbi.nlm.nih.gov](https://pubmed.ncbi.nlm.nih.gov/40891499/))
Environment and cultural inputs then modulate that genetic program. Nitrogen, phosphorus, water, light spectrum, and root microbiome influence trichome density and chemical output: for example, trials manipulating nutrient regimes and plant-growth-promoting rhizobacteria showed measurable changes in trichome abundance and cannabinoid profiles. That means growers who alter nutrition or introduce microbial inoculants can shift when and how trichomes reach visual maturity. ([pubmed.ncbi.nlm.nih.gov](https://pubmed.ncbi.nlm.nih.gov/37275248/))
Because color is downstream of both genotype and environment, a universal color chart that prescribes a single harvest time across cultivars and rooms is not scientifically tenable. Color charts work as local heuristics — for one cultivar in one controlled environment with consistent lighting and handling — but they do not generalize across diverse genetics and practices.
Grower objectives and alternative decision frameworks
Define the objective first. If your priority is maximizing acidic-cannabinoid mass (e.g., THCA), timed metabolomics across the flowering window for your cultivar under your environment is the most defensible approach. If you prioritize a terpene-forward bouquet, integrate volatile assays at several candidate harvest dates because terpenes can peak earlier or decline rapidly in some genetics. A single color snapshot cannot resolve these different optima; it can only be a piece of the decision matrix. ([pubmed.ncbi.nlm.nih.gov](https://pubmed.ncbi.nlm.nih.gov/39806251/))
Combine simple analytics with structured visual scoring. For practical decision-making: (1) pick representative sampling strata (apical vs. mid vs. lower colas), (2) document viewing conditions and magnification when scoring trichome color, and (3) send small composite samples for targeted cannabinoid and terpene assays at two or three dates near the visually identified window. Over one or two runs you will build a crop- and cultivar-specific map that shows how color changes relate to the chemistry you actually care about. ([pubmed.ncbi.nlm.nih.gov](https://pubmed.ncbi.nlm.nih.gov/40139041/))
When lab data are unavailable, use color trends rather than absolutes: an increase in the proportion of milky heads across apical nodes is a more actionable signal than a single '50% amber' snapshot taken in inconsistent conditions. In other words, color is best used to triage and schedule sampling, not to seal the final decision by itself.
- Decide whether your primary metric is cannabinoid mass, cannabinoid ratio, terpene profile, or shelf stability.
- Build a small, repeatable sampling plan and pair visual scoring with 1–2 lab assays.
Why a color chart is not a universal harvest clock
Color charts are attractive because they are fast, cheap, and visually intuitive. But they collapse many independent variables — genetics, microenvironment, optical setup, and post-harvest handling — into a single ordinal scale. Because the underlying chemistry that growers care about (acidic vs. neutral cannabinoids, terpene composition, oxidation products) can change independently of color, a chart can give false confidence if used without corroborating data. The primary literature and review work caution against reading the color scale as a universal proxy. ([pubmed.ncbi.nlm.nih.gov](https://pubmed.ncbi.nlm.nih.gov/34616415/))
Laboratory-grade measurements (targeted LC–MS for cannabinoids, GC–MS for terpenes) remain the gold standard for answering the questions that matter commercially and scientifically. Newer imaging methods (e.g., CARS microscopy, mass-spectrometry imaging) can provide spatially resolved chemical information at the trichome level, but these are research tools rather than routine grower tools. Use color charts as local operating procedures — calibrate them against lab assays for each cultivar and environment before you rely on them. ([pubmed.ncbi.nlm.nih.gov](https://pubmed.ncbi.nlm.nih.gov/30419820/))
Finally, remember that some desirable outcomes (for example, a particular sensory terpene bouquet) require preventing chemical loss. If preserving volatile monoterpenes is the priority, that objective might push harvest earlier than a chart calibrated to total acid cannabinoid mass would advise. The chart never replaces priorities and tradeoffs; it only informs them.
Reading records and claims: practical guidance for growers and readers
When you read a lab report or a seed-to-sale trace, check the sampling metadata. Ask: what tissue was sampled, how many plants were pooled, how long between harvest and assay, and what assays were used (for example: acid + neutral or neutral-only cannabinoid reporting, and which terpene panel). Without that context, numeric potency figures can mislead because post-harvest transformations (decarboxylation, terpene loss, oxidation) change the chemistry between harvest and assay. ([pubmed.ncbi.nlm.nih.gov](https://pubmed.ncbi.nlm.nih.gov/33526109/))
If someone cites a color-based harvest recommendation, ask for the calibration data: which cultivar, what lighting and magnification, and which lab assays were used to link color stages to chemical outcomes. If a color chart is published without that metadata, treat it as an anecdotal heuristic, not a universal rule. The Maine Office of Cannabis Policy emphasizes clear documentation and traceability in the regulated supply chain; while color charts are operational tools for producers, documented sampling and testing remain the basis for compliance and consumer information. ([www1.maine.gov](https://www1.maine.gov/dafs/ocp/resources/guidance-documents))
Finally, record your own empirical map. Over a season, pair a small number of targeted lab assays with consistent color-scoring and handling. That local dataset is the most valuable asset a grower has: it turns general science into a cultivar- and facility-specific decision framework.
- Always read sampling metadata on lab reports.
- Request color-chart calibration data before using it to set harvest dates.
- Build your own paired color + assay dataset across one or two flower cycles.
Uncertainties, open questions, and where the evidence is heading
Although the field has made rapid progress — from laser-microdissection to single-trichome metabolomics and proteomics — several uncertainties remain. We lack large, multi-cultivar longitudinal studies that map trichome optical state to full volatile and non-volatile metabolomes across diverse environmental regimes. Existing work is powerful but often limited to a handful of cultivars or carefully controlled environments. ([pubmed.ncbi.nlm.nih.gov](https://pubmed.ncbi.nlm.nih.gov/40139041/))
Mechanistically, the drivers of color change at the molecular level (for example, which specific oxidation or polymerization reactions drive ambering in different chemotypes) need clearer chemical identification. New label-free imaging and mass-spectrometry imaging techniques show promise for resolving these mechanisms in situ, but they are still largely research-stage tools. ([pubmed.ncbi.nlm.nih.gov](https://pubmed.ncbi.nlm.nih.gov/30419820/))
From a grower-practice perspective the most useful future work will be pragmatic: cultivar-specific decision protocols that pair a minimal set of assays with reproducible visual scoring, and open datasets that allow growers to see how genetics and environment interact over multiple seasons. Until then, treat color charts as locally calibrated heuristics and lean on assay data for the high-stakes decisions.
Questions this guide answers
Does an amber trichome always mean lower THC?
No. Ambering reflects multiple processes (oxidation, pigment change, resin concentration) and does not directly measure THC or THCA. Lab assays are required to quantify cannabinoids. Some oxidation or thermal history may increase neutral THC proportion by decarboxylation, but color alone cannot reliably predict that change. ([pubmed.ncbi.nlm.nih.gov](https://pubmed.ncbi.nlm.nih.gov/34616415/))
Can I use a phone photo and a chart to decide harvest?
You can, but only if you control for lighting, magnification, and sampling consistently and you have calibrated the chart to lab assays for that cultivar and environment. Uncalibrated phone photos under varying light are a poor guide. ([pubmed.ncbi.nlm.nih.gov](https://pubmed.ncbi.nlm.nih.gov/30419820/))
Which matters more for flavor: harvest timing or post-harvest handling?
Both matter. Terpenes are volatile and can be lost during drying and curing; harvest timing determines the baseline terpene profile, and post-harvest handling determines how much of that profile survives to assay or to the consumer. Preservation protocols can be as important as the exact harvest day. ([pubmed.ncbi.nlm.nih.gov](https://pubmed.ncbi.nlm.nih.gov/33526109/))
If I only care about THCA mass, what should I measure?
Track THCA over multiple dates with consistent sampling (same tissues, pooled same way), and pair visual scoring with targeted LC–MS cannabinoid assays. Use that crop-specific time course to pick a harvest date that maximizes the metric you care about. ([pubmed.ncbi.nlm.nih.gov](https://pubmed.ncbi.nlm.nih.gov/23280038/?dopt=Abstract))
Does Maine regulate trichome color or prescribe harvest charts?
No. Maine’s Office of Cannabis Policy provides regulatory guidance and emphasizes documentation and testing for compliance, but it does not prescribe cultivation heuristics like trichome color charts. Production practices and harvest timing remain the grower’s operational choices within Maine’s regulatory framework; growers should follow OCP guidance on sampling, testing, and recordkeeping. ([www1.maine.gov](https://www1.maine.gov/dafs/ocp/resources/guidance-documents))
Educational information only. This guide is not medical or legal advice and does not recommend a product, dose, treatment, or outcome.